In an island defined by tourism volume, the most defensible hospitality investments are built on scarcity. Tevah Suite Ubud is one such project — a 13-unit boutique eco-luxury development located in Kenderan, Tegalalang, within one of Bali's most established and supply-constrained luxury resort clusters.
Developed by PT Jam Asia Property (Triproom.id), this asset is engineered around a single thesis: high cashflow per unit, fast capital recovery, and controlled downside risk — without relying on scale to generate returns. It is a rare opportunity for investors seeking institutional-grade performance from a low-density, operationally simple hospitality asset.
Executive Summary
Tevah Suite Ubud is a precision-built boutique eco-luxury hospitality asset in Ubud, Bali, designed around scarcity, pricing power, and operational efficiency — not scale. The land is freehold and fully owned, eliminating acquisition risk from day one.
- Freehold land (fully owned) — zero acquisition risk
- Low-density model (13 units) — protected ADR positioning
- Strong NOI margin (~55%)
- Fast payback period (~3.8 years)
- Institutional-grade IRR: 24–27%
- Exit multiple: 9–10x EBITDA
1. Core Project Metrics
| Metric | Value |
|---|---|
| Units | 13 |
| ADR (Base) | IDR 1.8M |
| Occupancy (Stabilized Avg) | 70% |
| Total Investment | IDR 10 Billion |
| Development Timeline | 12–18 months |
| Operating Model | Rooms-only (no F&B) |
2. Annual Financial Model
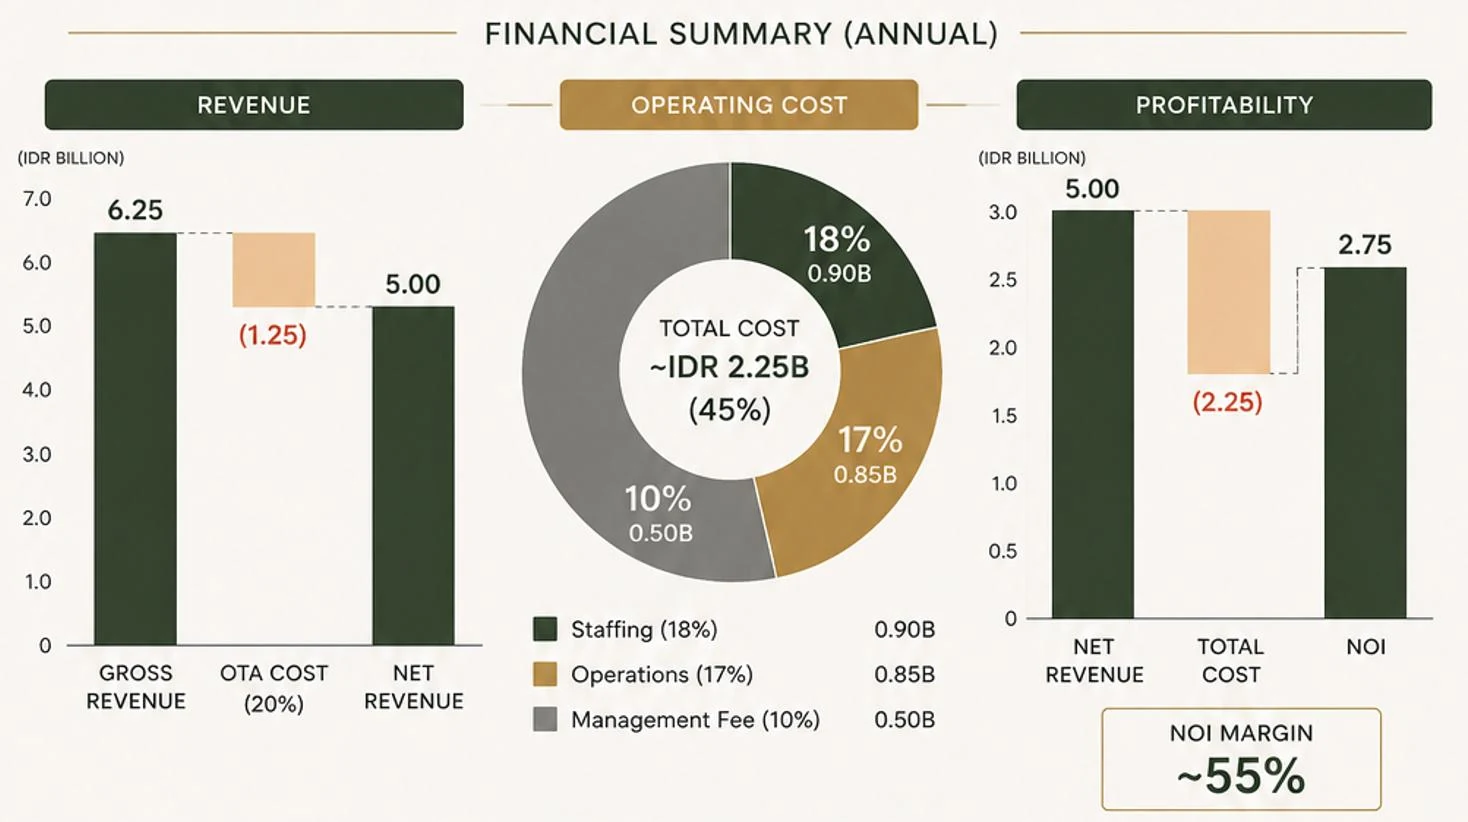
Financial Summary
| Category | Component | % | Value |
|---|---|---|---|
| Revenue | Gross Revenue | — | ~IDR 6.25B |
| Revenue | OTA Cost | (20%) | (IDR 1.25B) |
| Revenue | Net Revenue | — | ~IDR 5.00B |
| Operating Cost | Staffing | 18% | 0.90B |
| Operating Cost | Operations | 17% | 0.85B |
| Operating Cost | Management Fee | 10% | 0.50B |
| Operating Cost | Total Cost | 45% | ~2.25B |
| Profitability | NOI | — | ~IDR 2.75B |
| Profitability | NOI Margin | — | ~55% |

4. Per Unit Economics
| Category | Component | Monthly | Annual | Notes |
|---|---|---|---|---|
| Core Assumptions | Units | — | 13 | Total inventory |
| Core Assumptions | Occupancy | — | 70% | Stabilized |
| Core Assumptions | ADR | — | IDR 1.8M | Blended rate |
| Core Assumptions | Days | 30 | 365 | Full operation |
| Revenue | Available Nights | 30 | — | — |
| Revenue | Occupied Nights | 21 | 256 | 70% occupancy |
| Revenue | Gross Revenue | 37.8M | 460M | Before OTA |
| Revenue | OTA Cost (20%) | (7.56M) | (92M) | Distribution cost |
| Revenue | Net Revenue | ~30.2M | ~368M | After OTA |
| Cost Structure | Staffing (18%) | 5.4M | 66M | — |
| Cost Structure | Operations (17%) | 5.1M | 63M | — |
| Cost Structure | Management Fee (10%) | 3.0M | 37M | — |
| Cost Structure | Total Cost (45%) | ~13.6M | ~166M | — |
| Profitability | NOI per Unit | ~16.6M | ~200M+ | Core profit |
| Profitability | NOI Margin | ~55% | ~55% | High efficiency |
| Seasonality | Low Season | 11–13M | — | Downside floor |
| Seasonality | Shoulder Season | 15–18M | — | Stable months |
| Seasonality | High Season | 22–26M | — | Profit driver |
| Seasonality | Peak (Dec) | 27M+ | — | Highest yield |
| Capital Efficiency | Cost per Unit | — | ~770M | 10B / 13 units |
| Capital Efficiency | Yield per Unit | — | ~26% | NOI / cost |
| Capital Efficiency | Payback per Unit | — | ~3.8 yrs | Fast recovery |
| Benchmark | NOI Margin | — | ~55% | vs 30–40% market |
| Benchmark | Payback | — | ~3.8 yrs | vs 6–10 yrs |
| Benchmark | Yield | — | ~26% | vs 10–15% |
Each unit generates approximately IDR 16–20M monthly NOI, or ~IDR 200M annually, on a ~IDR 770M cost basis, delivering ~26% yield with sub-4 year payback.
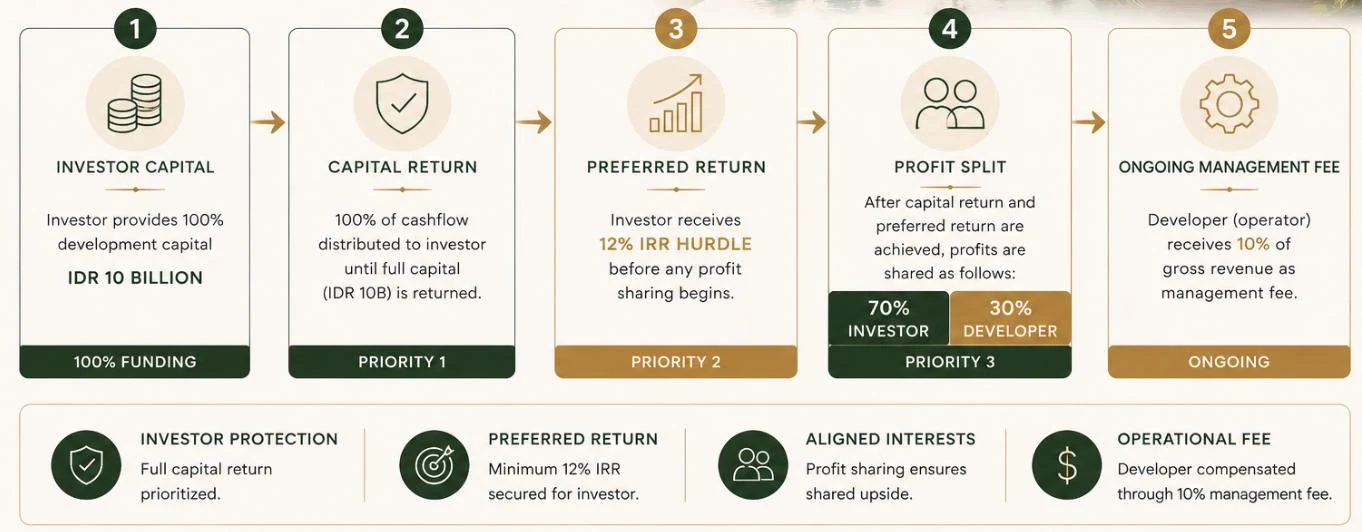
5. Investment Structure (Waterfall)
A. Capital Contribution
| Party | Contribution | Value | Notes |
|---|---|---|---|
| Investor | 100% Development Capital | IDR 10B | Full funding responsibility |
| Developer | Land (Freehold) + Execution + Operations | In-kind | Includes concept, build oversight, and operator (Triproom ecosystem) |
B. Waterfall Distribution Structure
| Step | Phase | Priority | Distribution | Details |
|---|---|---|---|---|
| 1 | Capital Return | Highest | 100% to Investor | All distributable cashflow allocated to investor until full IDR 10B capital is returned |
| 2 | Preferred Return | High | 100% to Investor | Investor receives 12% IRR hurdle before any profit sharing begins |
| 3 | Profit Split | Residual | 70% Investor / 30% Developer | Applied after capital + preferred return are fully achieved |
C. Management Fee (Operating Layer)
| Component | Structure | Value | Notes |
|---|---|---|---|
| Management Fee | % of Gross Revenue | 10% | Paid to operator (developer) on ongoing basis, independent of profit waterfall |
D. Economic Summary
| Component | Investor | Developer |
|---|---|---|
| Capital Contribution | 100% (IDR 10B) | 0% (land in-kind) |
| Capital Return Priority | First | After investor |
| Preferred Return | 12% IRR | — |
| Profit Share | 70% | 30% |
| Management Income | — | 10% revenue fee |
| Operational Control | Limited | Full |
E. Structure Logic (Investor View)
- Capital protected first (return priority)
- Guaranteed minimum return (12% hurdle)
- Upside participation after hurdle
- Clear alignment between investor & developer
This structure prioritizes full capital return and a 12% preferred return to the investor, followed by a 70/30 profit split, ensuring strong downside protection with aligned upside participation.
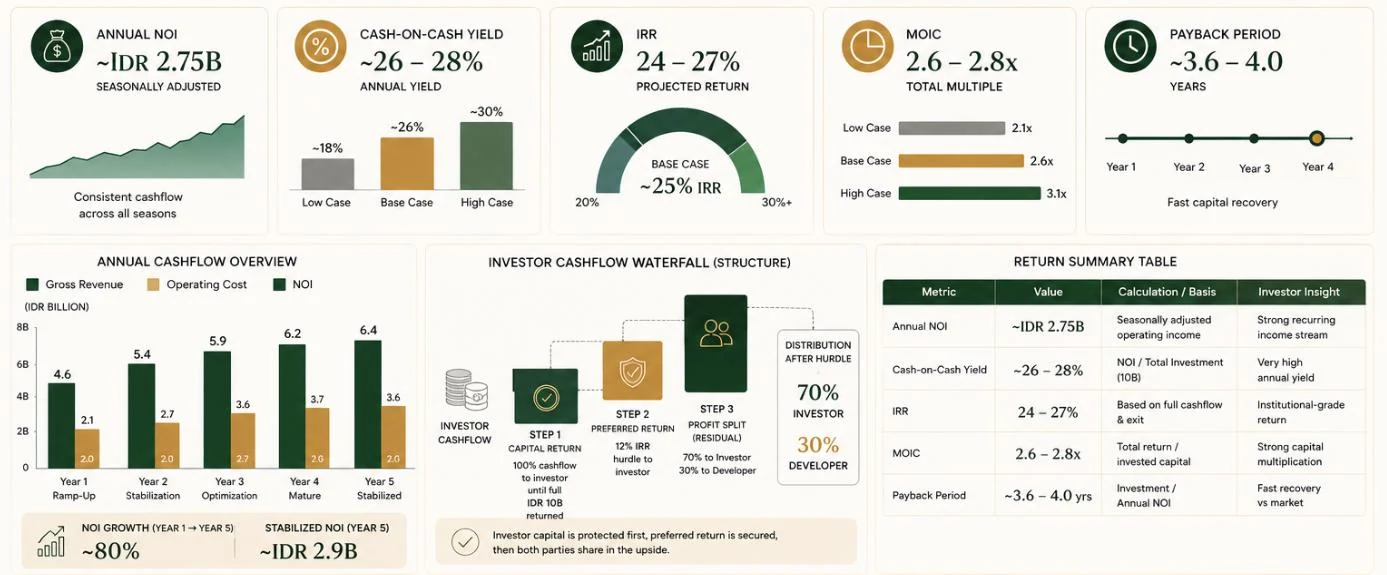
6. Investor Return Profile (Comprehensive)
| Category | Metric | Value | Calculation / Basis | Investor Insight |
|---|---|---|---|---|
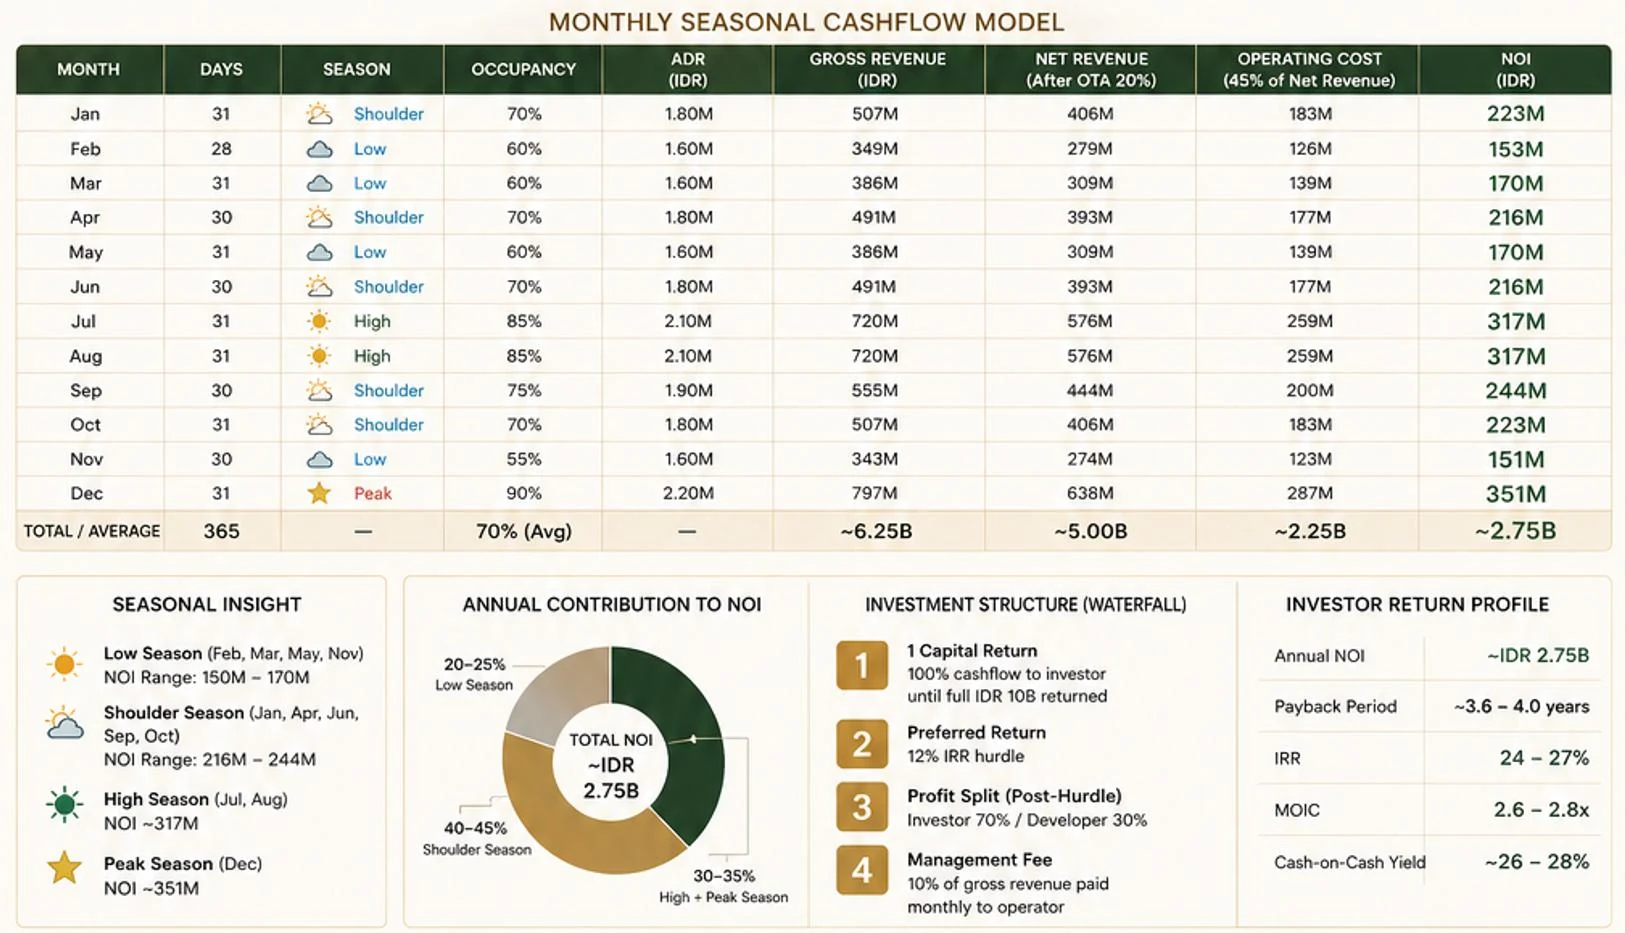
| Income Performance | Annual NOI | ~IDR 2.75B | Seasonal adjusted operating income | Strong recurring income stream |
| Income Performance | Monthly NOI Range | 150M – 350M | Based on seasonality model | Stable + predictable cashflow |
| Income Performance | NOI Margin | ~55% | NOI / Net Revenue | High efficiency vs industry |
| Return Metrics | Cash-on-Cash Yield | ~26–28% | NOI / Total Investment (10B) | Very high annual yield |
| Return Metrics | IRR | 24–27% | Based on full cashflow + exit | Institutional-grade return |
| Return Metrics | MOIC | 2.6 – 2.8x | Total return / invested capital | Strong capital multiplication |
| Capital Recovery | Payback Period | ~3.6 – 4.0 years | Investment / Annual NOI | Fast recovery vs market |
| Capital Recovery | Capital Return Priority | 100% to Investor | Waterfall structure | Downside protection |
| Capital Recovery | Preferred Return | 12% IRR hurdle | Before profit split | Minimum return secured |
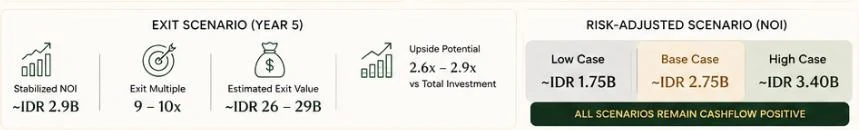
| Exit Upside | Stabilized NOI (Year 5) | ~IDR 2.9B | Growth from ramp-up | Higher exit base |
| Exit Upside | Exit Multiple | 9 – 10x EBITDA | Market benchmark (Bali luxury) | Conservative assumption |
| Exit Upside | Exit Value | ~IDR 26 – 29B | NOI × multiple | Significant upside |
| Risk-Adjusted View | Low Case NOI | ~1.75B | Conservative scenario | Still profitable |
| Risk-Adjusted View | Downside Protection | Positive cashflow | All scenarios | No capital erosion risk |
| Risk-Adjusted View | Upside Potential | ADR + occupancy growth | Market-driven | Expandable returns |
The project delivers approximately IDR 2.75B annual NOI, generating ~26–28% cash yield, with a sub-4 year payback, and a projected 2.6–2.8x total return, supported by strong operational margins and clear exit visibility.
7. Cashflow Timeline
| Phase | Timeline | Description |
|---|---|---|
| Development | Year 1–2 | Capital deployment |
| Ramp-Up | Year 3 | Partial revenue |
| Stabilization | Year 4 | Full NOI |
| Payback | Year 4–5 | Capital returned |
| Yield Phase | Year 6+ | Profit distribution |
8. Conclusion
Tevah Suite Ubud represents a high-conviction investment combining strong recurring income, controlled downside, fast capital recovery, and meaningful exit upside — all supported by a prime Ubud location, proven demand segment, and efficient operating model.
- Strong recurring income
- Controlled downside
- Fast capital recovery
- Meaningful exit upside
Why This Works
This is not a speculative development. It is a cashflow-driven, positioning-led asset built on proven luxury location, structural demand for eco-luxury travel, low operational complexity (no F&B), and strong downside protection.
A high-conviction, risk-adjusted investment combining early capital recovery, strong recurring income, and clear exit upside — on freehold land in one of the world's most resilient luxury tourism destinations.
Project Overview
| Field | Value |
|---|---|
| Project Name | Tevah Suite Ubud |
| Location | Kenderan, Tegalalang – Ubud, Bali |
| Concept | Boutique eco-luxury hospitality |
| Scale | 13 units (low-density) |
| Land Status | Freehold (SHM – fully owned) |
| Timeline | 12–18 months to stabilization |
- Designed for intimacy, not volume
- Target market: couples, wellness travelers, digital nomads
- Rooms-only model (no F&B complexity)
- Positioned within an established luxury cluster
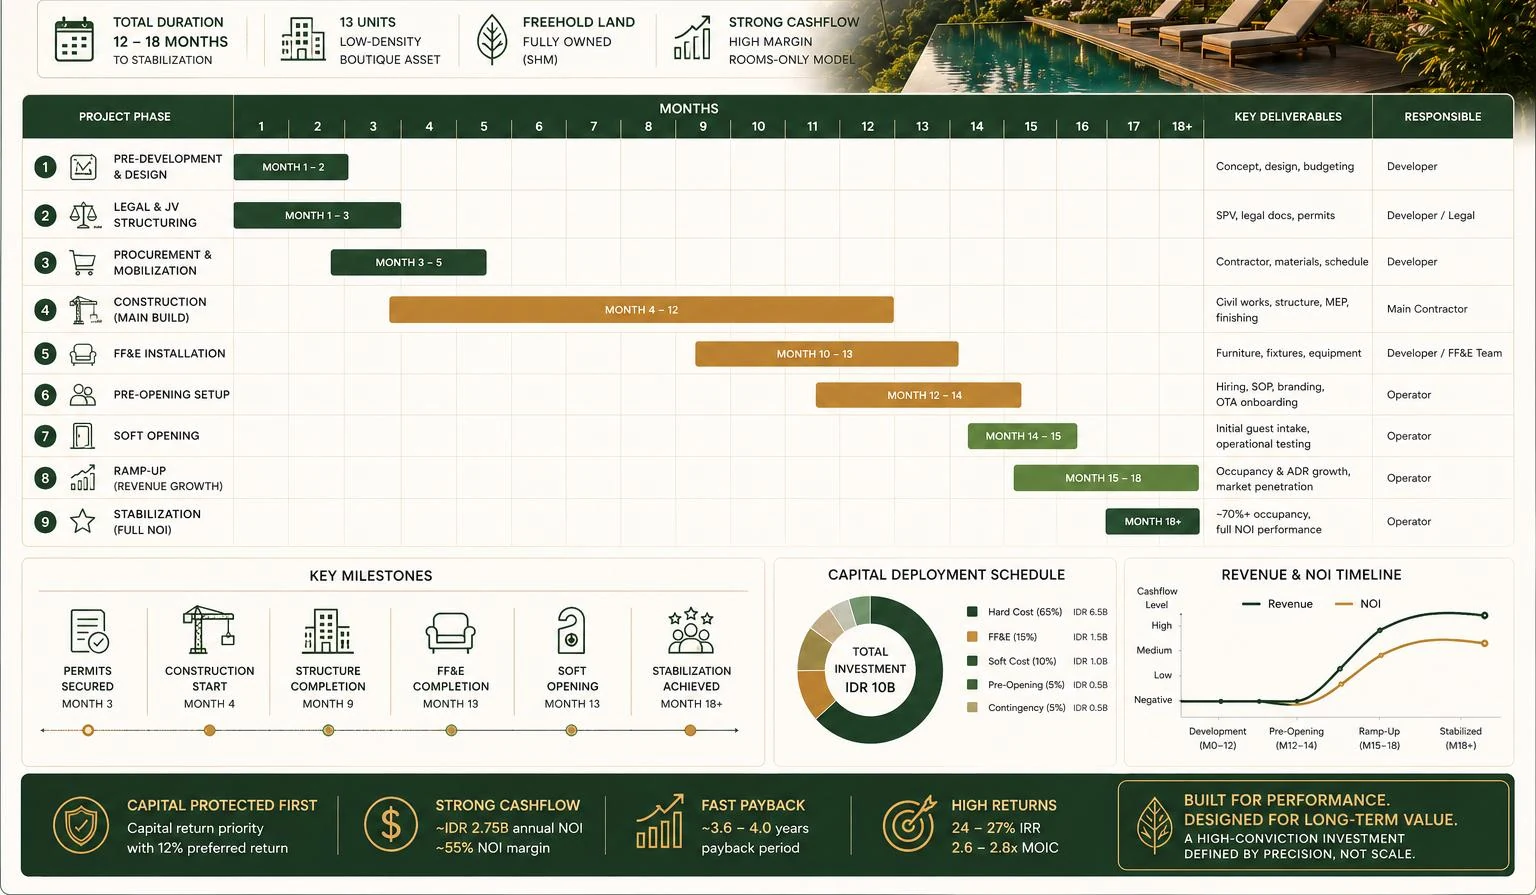
A. Master Development & Operation Timeline
| Phase | Timeline | Key Activities | Deliverables | Capital Deployment | Risk Level | Notes |
|---|---|---|---|---|---|---|
| 1. Pre-Development | Month 0–2 | Concept finalization, feasibility validation, design development, budgeting | Final concept, architectural drawings, cost plan | Minimal (soft cost) | Low | Land already owned (major advantage) |
| 2. Legal & Structuring | Month 1–3 | SPV setup, JV agreement, permits, compliance | Legal structure, permits ready | Low | Medium | Critical for investor protection |
| 3. Procurement & Mobilization | Month 2–4 | Contractor appointment, material sourcing, project scheduling | Signed contractor, project timeline | Medium | Medium | Lock cost early to avoid inflation risk |
| 4. Construction Phase | Month 4–12 | Civil works, structure, MEP, finishing | Physical development of 13 units | High (~65% capex) | Medium–High | Core execution phase |
| 5. FF&E Installation | Month 10–13 | Furniture, fixtures, equipment setup | Fully furnished units | Medium (~15% capex) | Medium | Defines brand quality |
| 6. Pre-Opening Setup | Month 12–14 | Staff hiring, SOP setup, branding, OTA onboarding | Operational readiness | Low–Medium | Low | Critical for smooth launch |
| 7. Soft Opening | Month 14–15 | Initial guest intake, operational testing | First revenue generation | Low | Low | Ramp-up phase |
| 8. Ramp-Up Phase | Month 15–18 | Occupancy growth, pricing optimization | Increasing revenue traction | — | Medium | Brand positioning phase |
| 9. Stabilization | Month 18+ | Achieve ~70% occupancy, full ADR | Full NOI performance | — | Low | Target performance achieved |
B. Capital Deployment Timeline
| Phase | % of Budget | Amount | Timing |
|---|---|---|---|
| Pre-Development + Legal | 5% | 0.5B | Month 0–3 |
| Hard Construction | 65% | 6.5B | Month 4–12 |
| FF&E | 15% | 1.5B | Month 10–13 |
| Pre-Opening | 5% | 0.5B | Month 12–14 |
| Contingency | 5% | 0.5B | Throughout |
| Total | 100% | IDR 10B | — |
C. Revenue & Cashflow Timeline
| Phase | Timeline | Revenue Status | NOI Status | Notes |
|---|---|---|---|---|
| Development | Month 0–12 | 0 | Negative | Capital deployment phase |
| Pre-Opening | Month 12–14 | Minimal | Negative | Setup stage |
| Soft Opening | Month 14–15 | Low | Low | Initial occupancy |
| Ramp-Up | Month 15–18 | Growing | Moderate | Brand traction |
| Stabilized | Month 18+ | Full (~5B/year) | Full (~2.7B/year) | Target performance |
D. Investor Return Timeline
| Phase | Timeline | Investor Outcome |
|---|---|---|
| Capital Deployment | Year 0–1 | Investment injected |
| Ramp-Up | Year 1–2 | Partial income |
| Stabilization | Year 2–3 | Full NOI achieved |
| Payback Phase | Year 3–4 | Capital returned |
| Yield Phase | Year 4+ | Profit distribution begins |
| Exit Window | Year 5–7 | Optional exit at 2.6–2.8x MOIC |
E. Risk Profile by Phase
| Phase | Risk Type | Mitigation |
|---|---|---|
| Pre-Development | Design / feasibility | Market validation, low-density concept |
| Construction | Cost overrun | Turnkey contractor + contingency |
| Pre-Opening | Operational readiness | SOP + experienced operator |
| Ramp-Up | Demand risk | Strong positioning + OTA strategy |
| Stabilization | Performance risk | High margin buffer (~55%) |
F. Strategic Timeline Insight
- Fast development cycle (12–14 months) → early revenue
- Short stabilization period (~3–6 months)
- Capital recovery starts early (Year 3–4)
- Exit optional after stabilization (Year 5+)
The project transitions from development to stabilized cashflow within approximately 18 months, enabling early revenue generation, full performance by Year 2–3, and capital recovery within 4 years.
H. Final Positioning
This timeline is designed to accelerate time-to-cashflow, minimize development risk exposure, optimize investor return cycle, and provide flexibility between yield and exit.
- Accelerate time-to-cashflow
- Minimize development risk exposure
- Optimize investor return cycle
- Provide flexibility between yield and exit
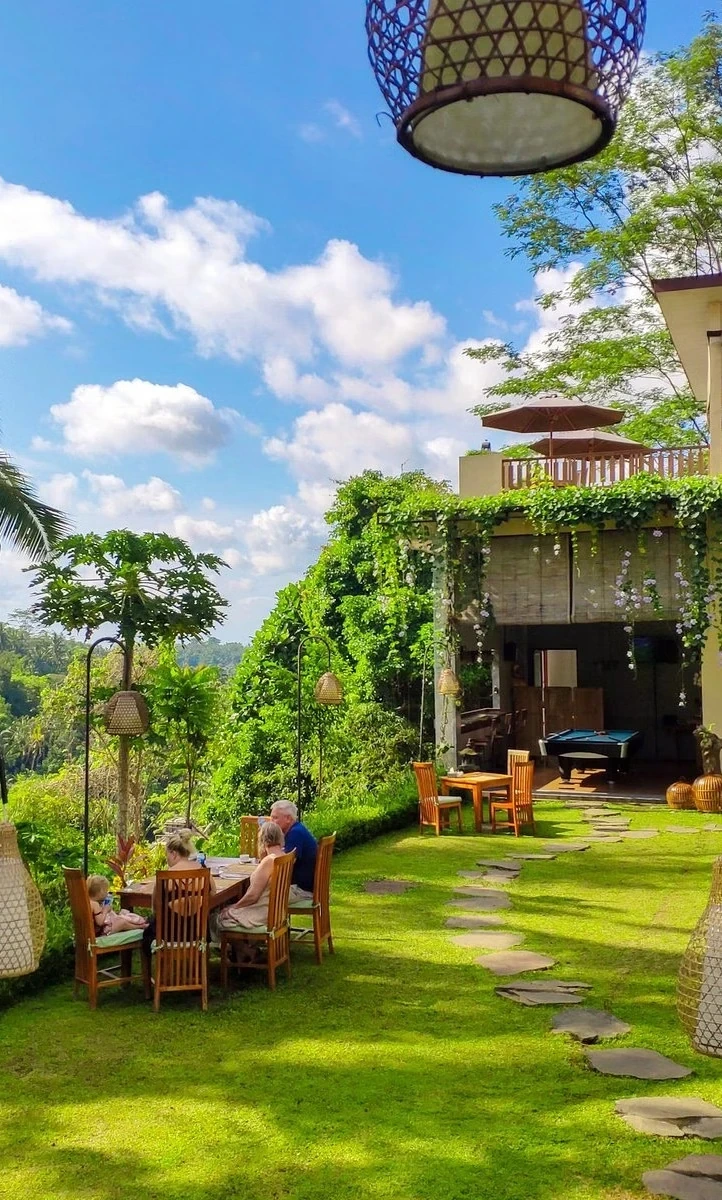
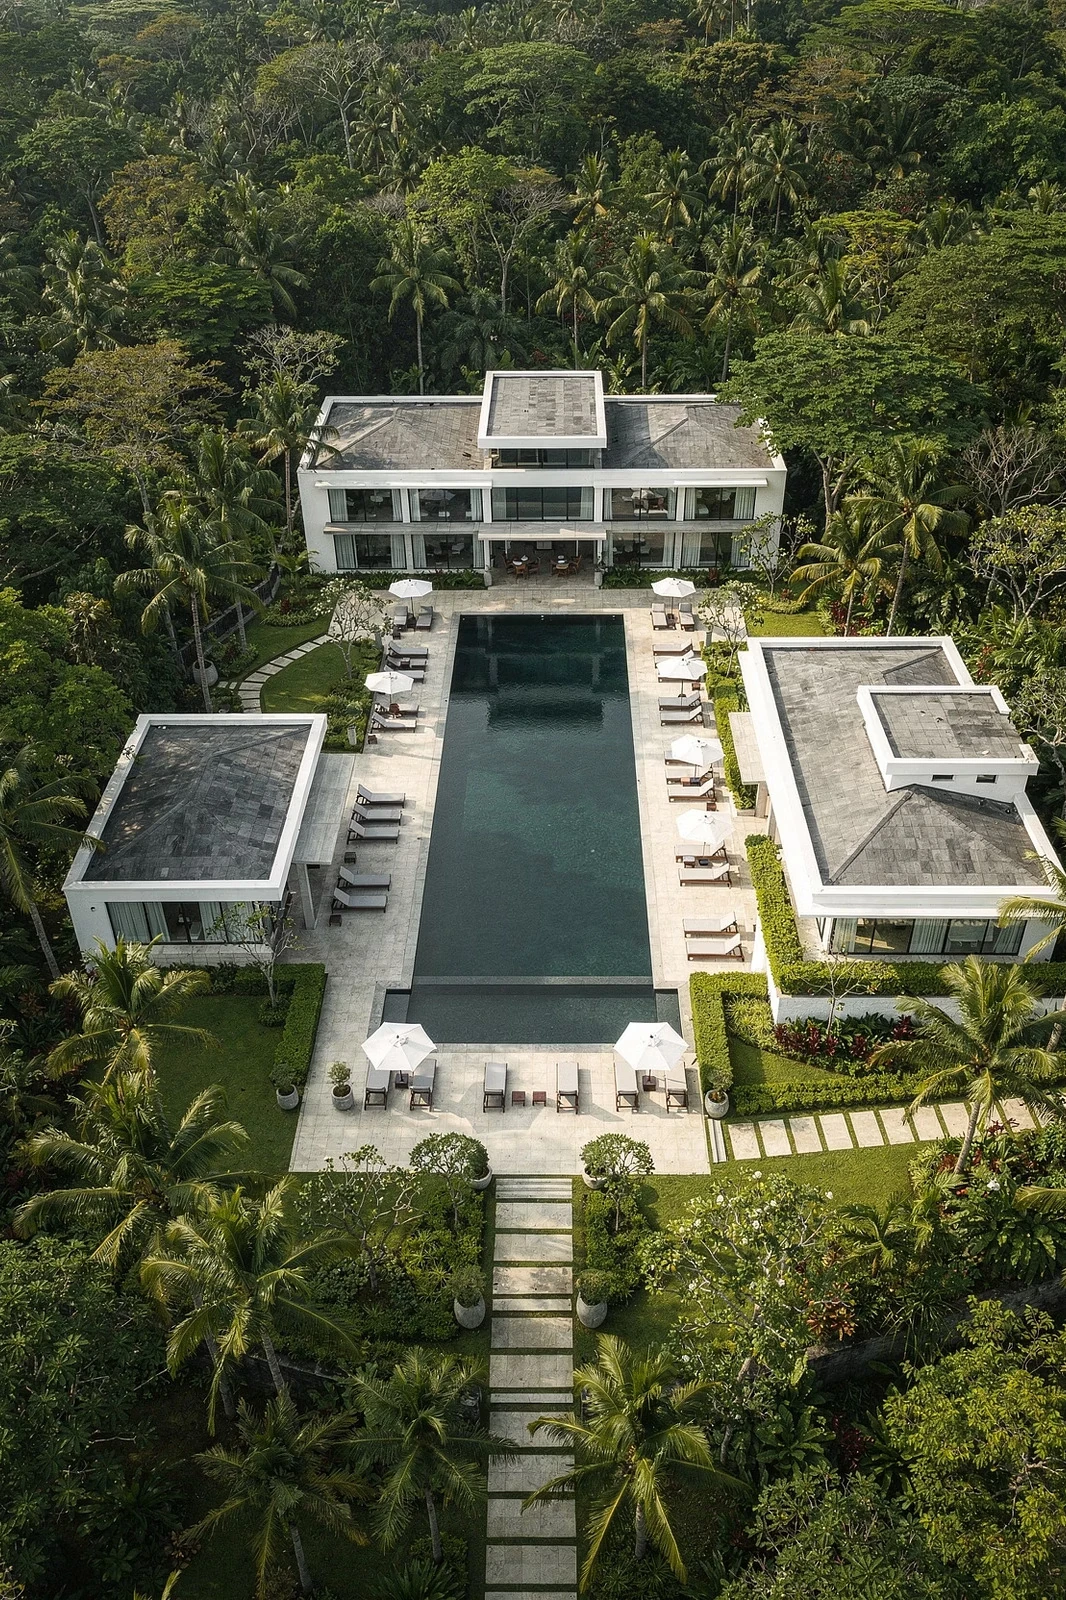
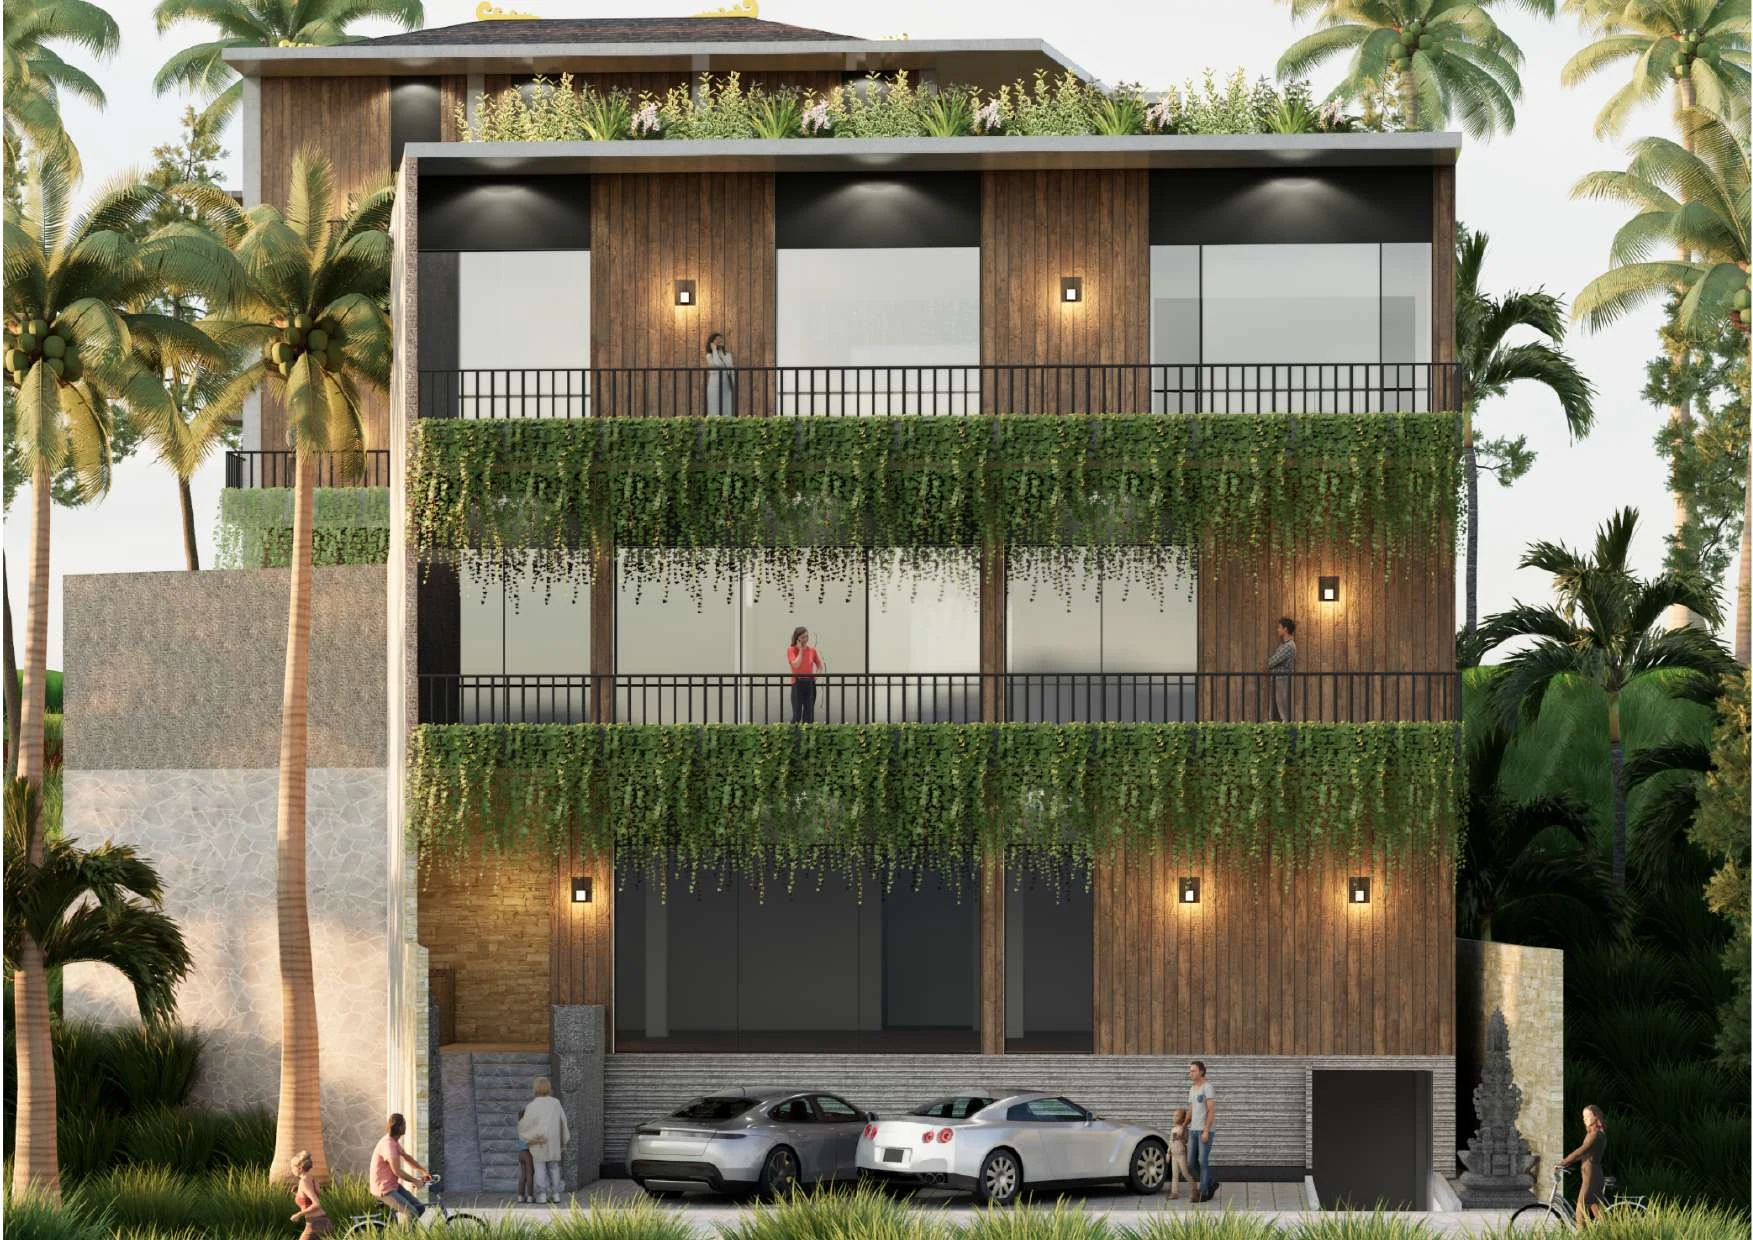
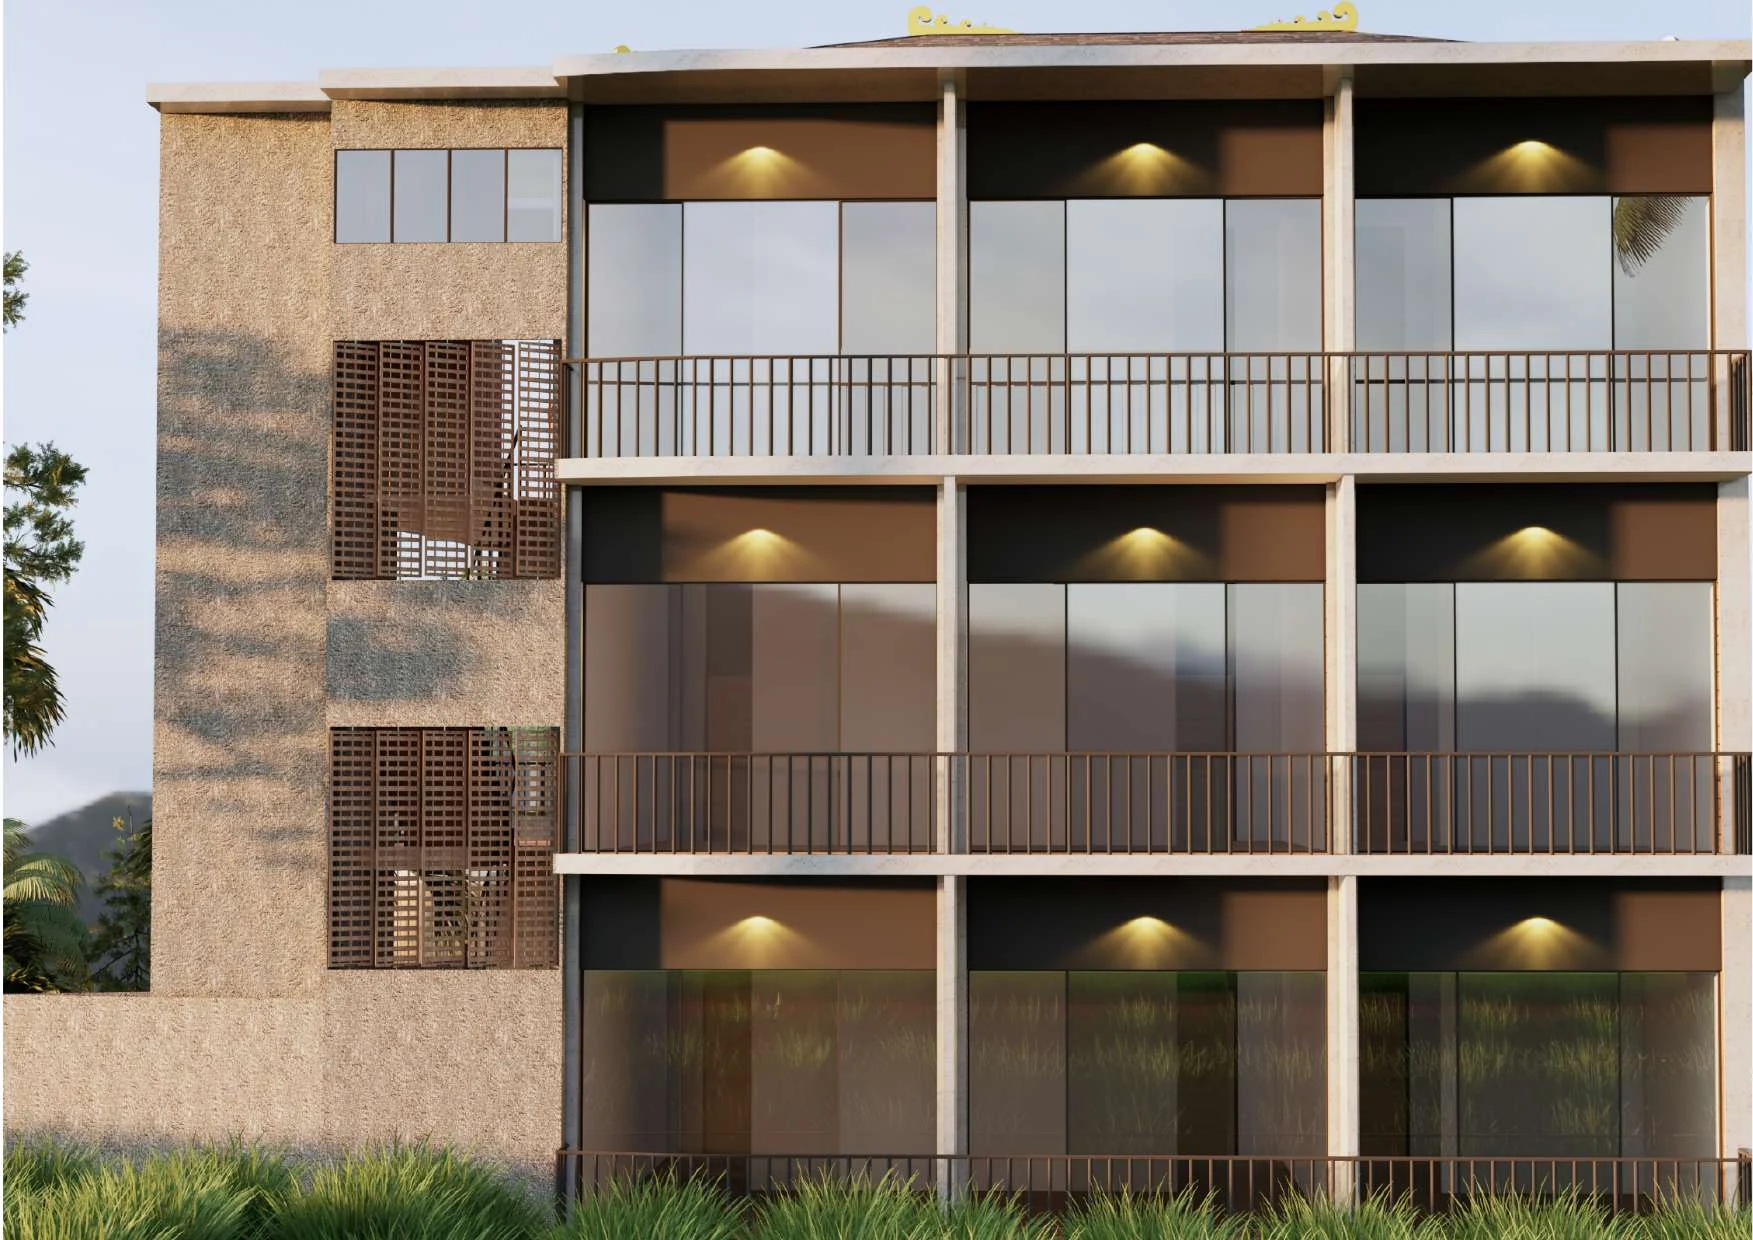
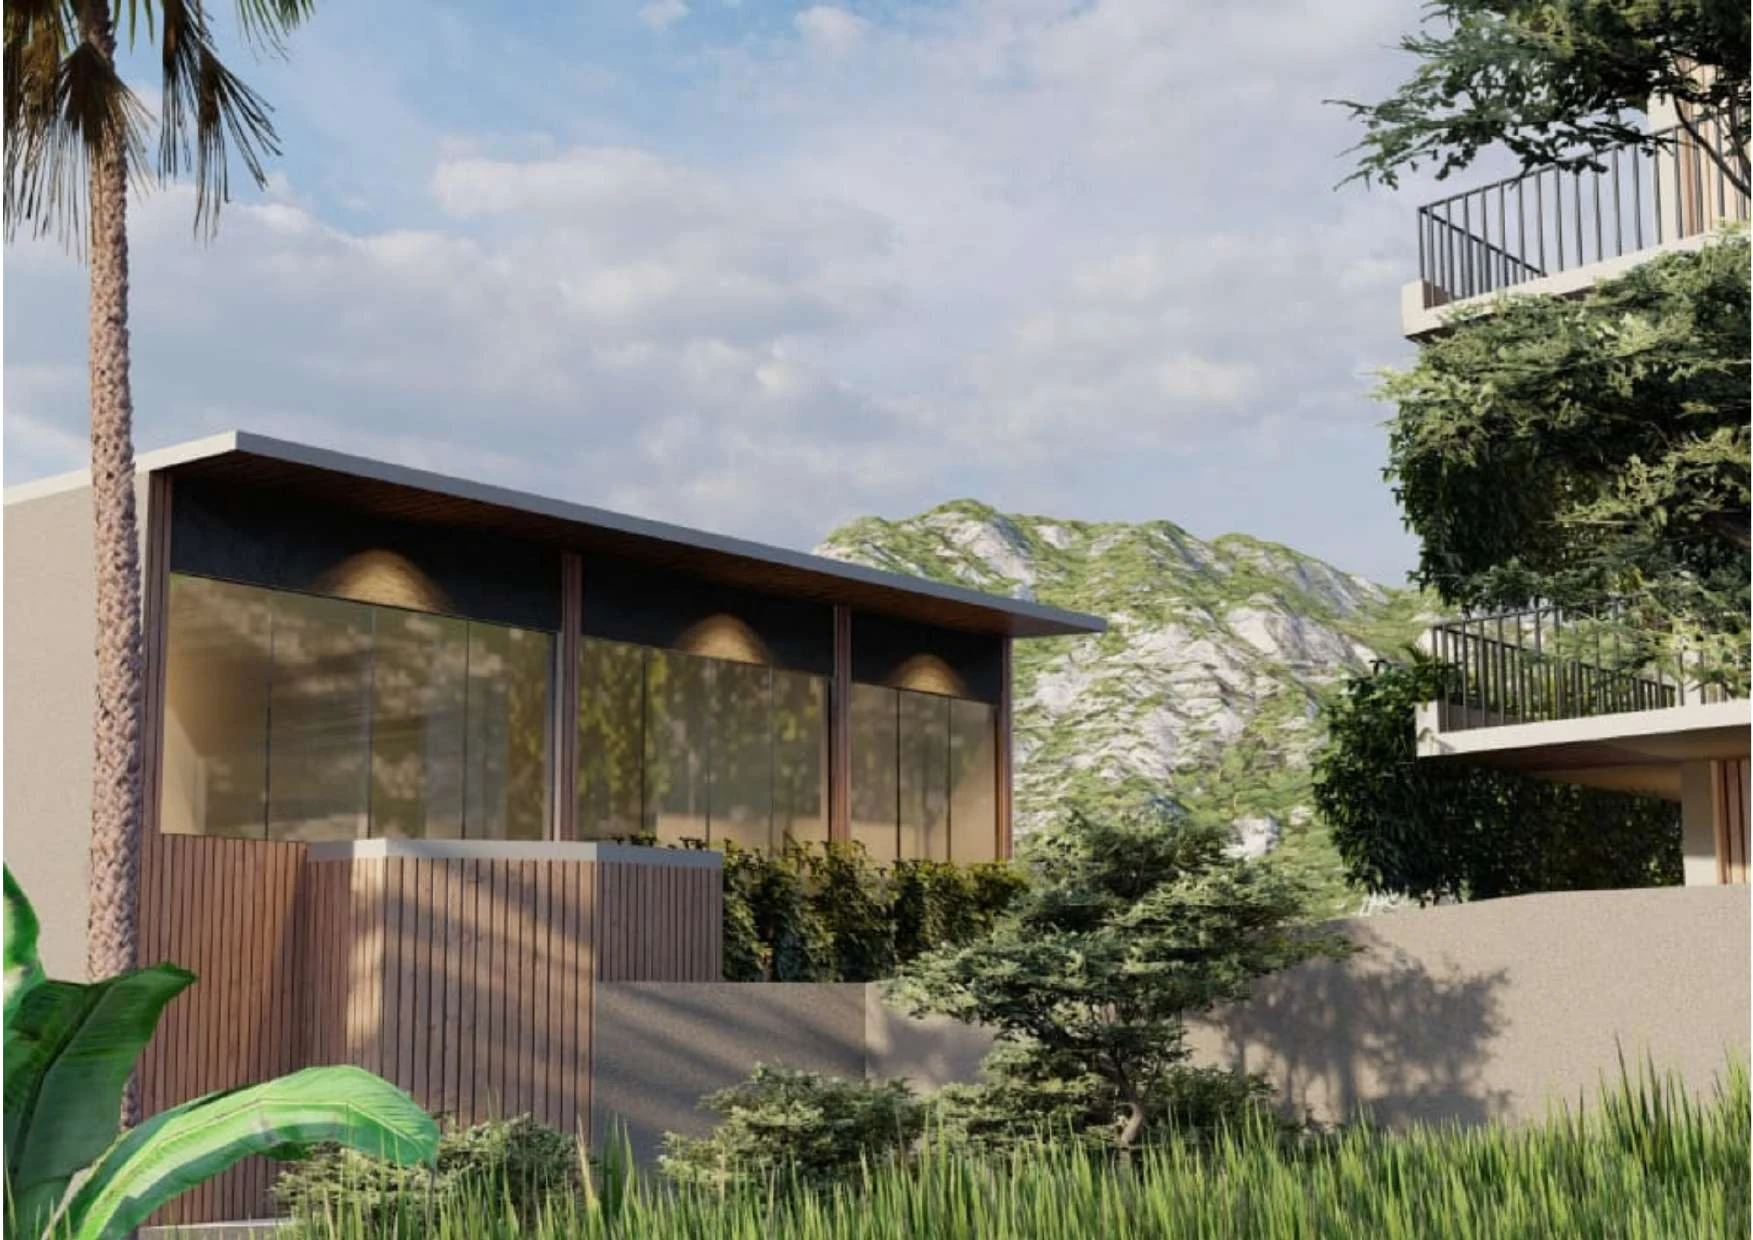
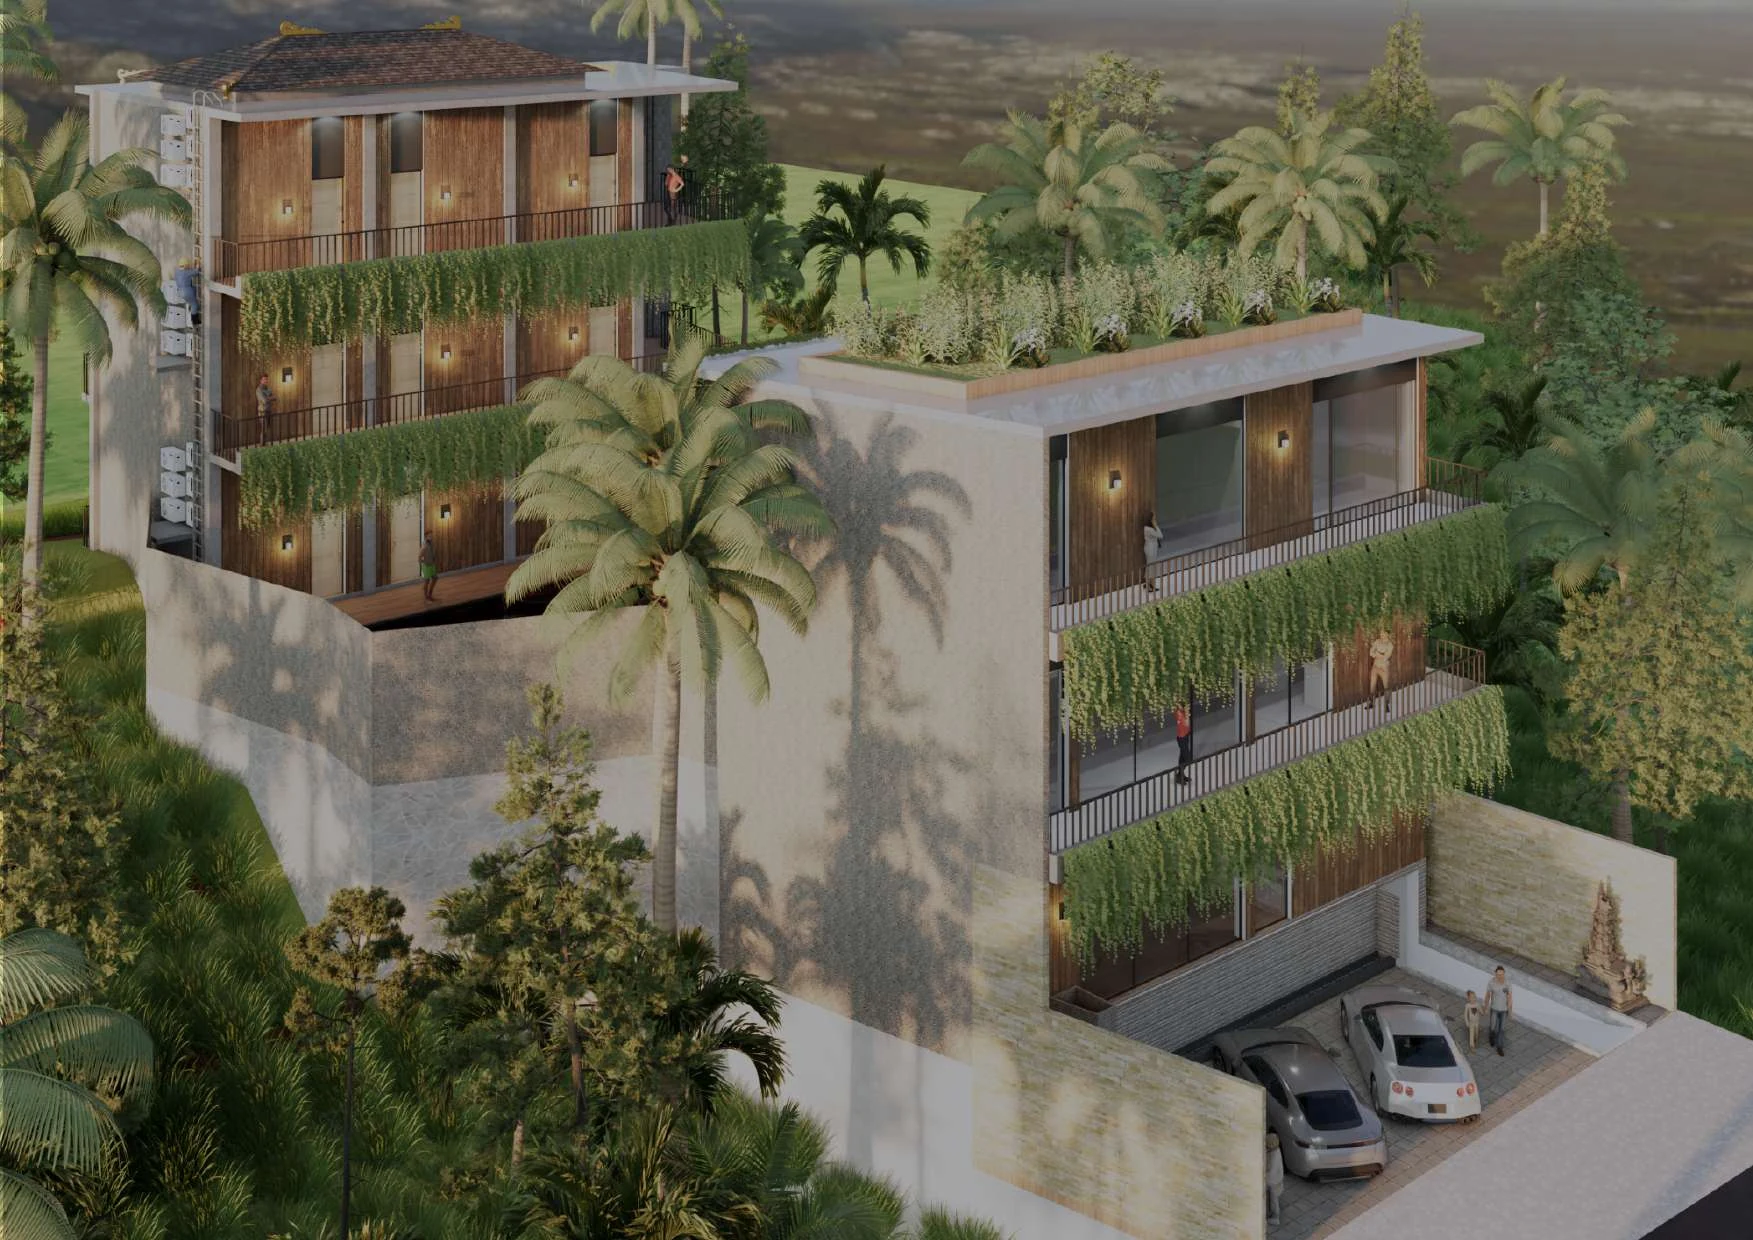
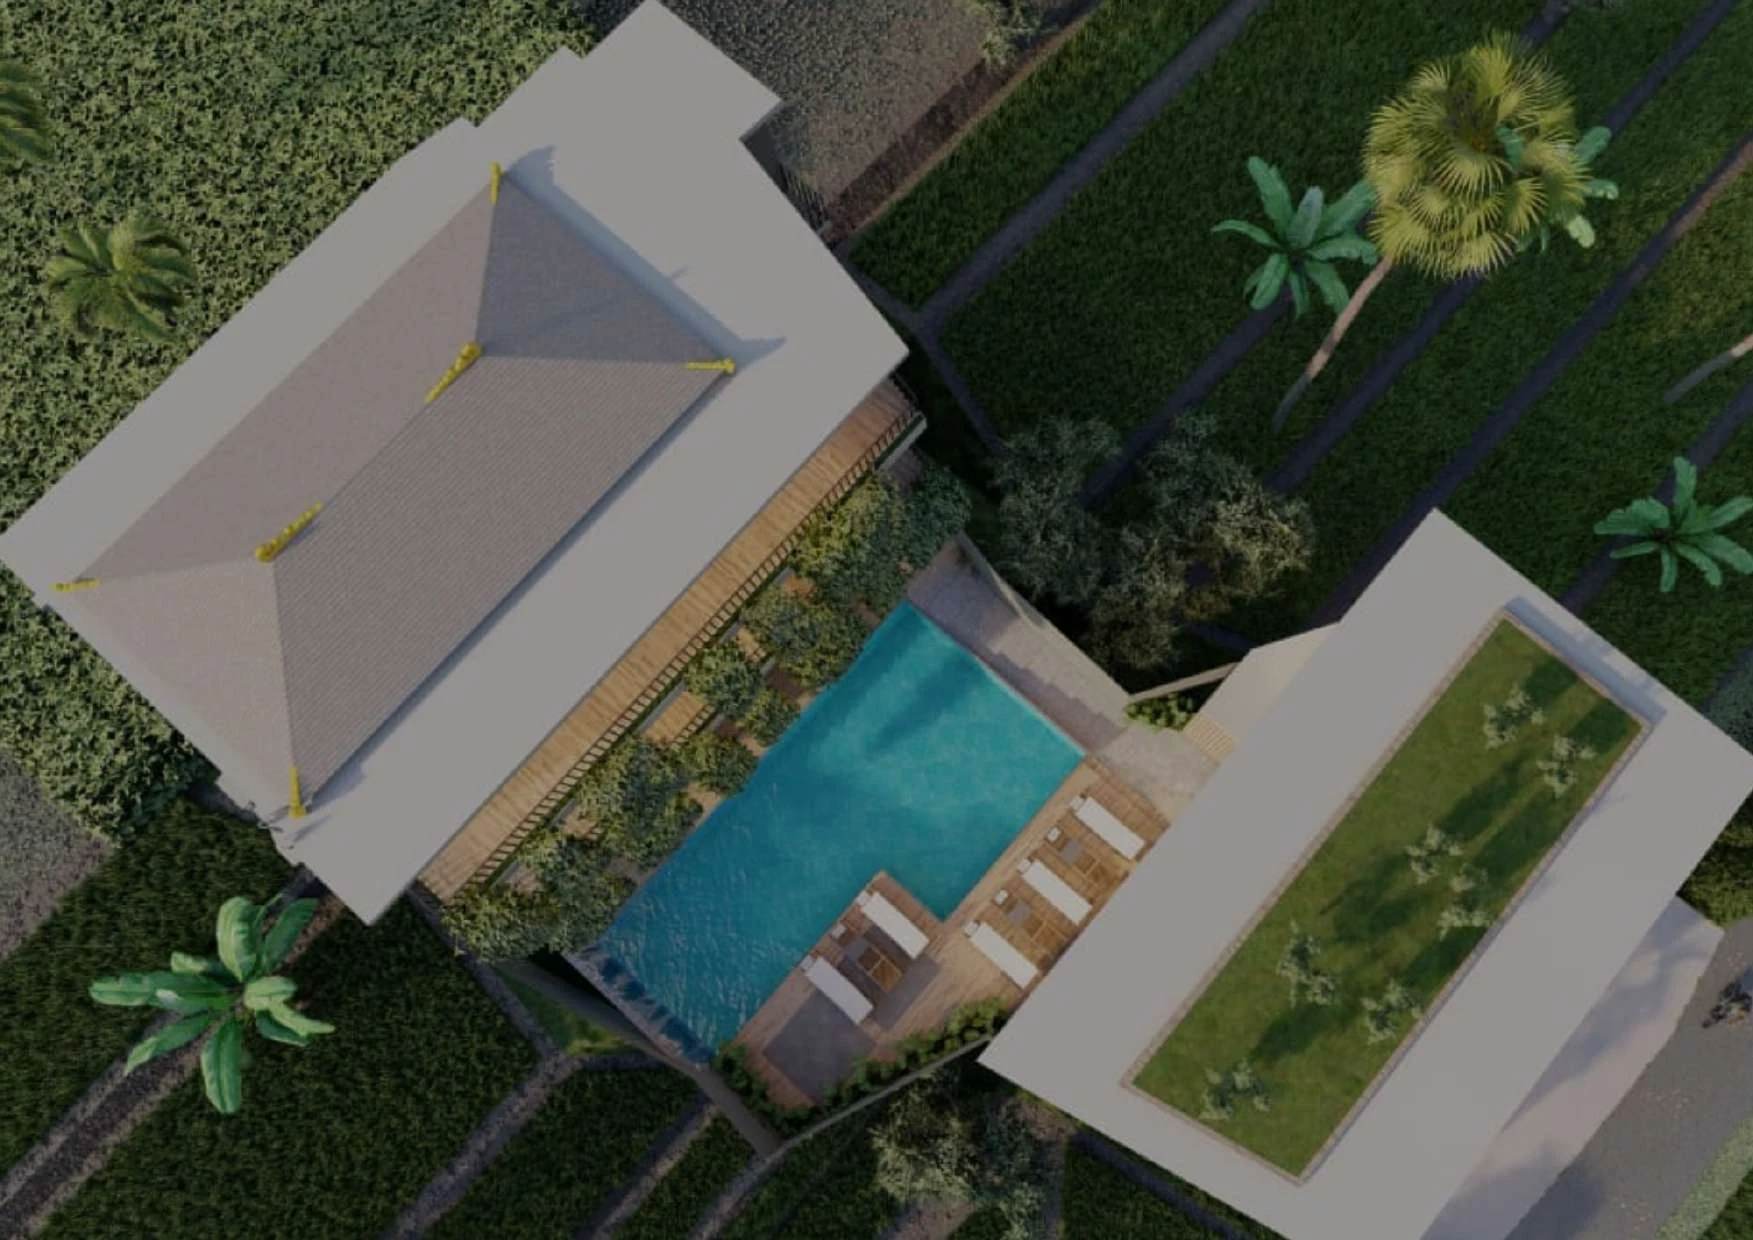
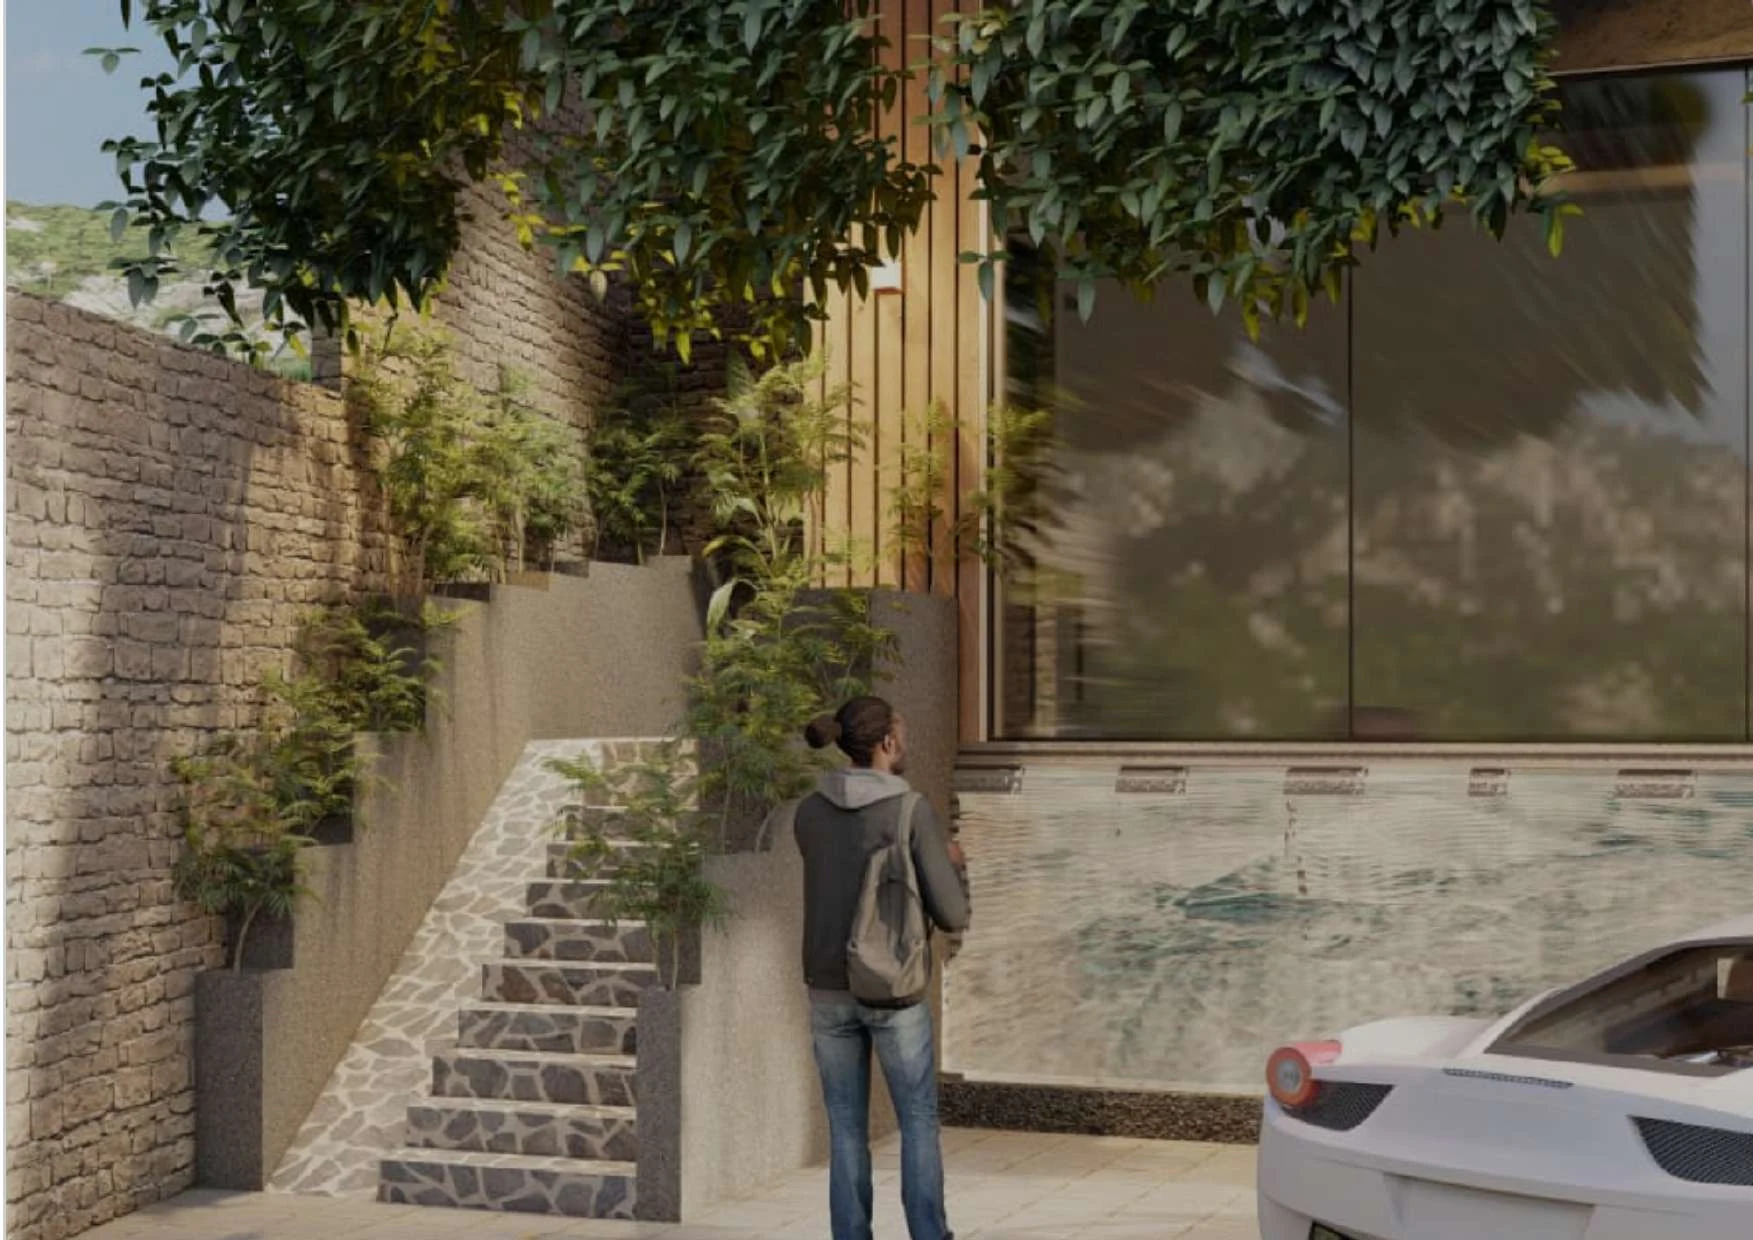
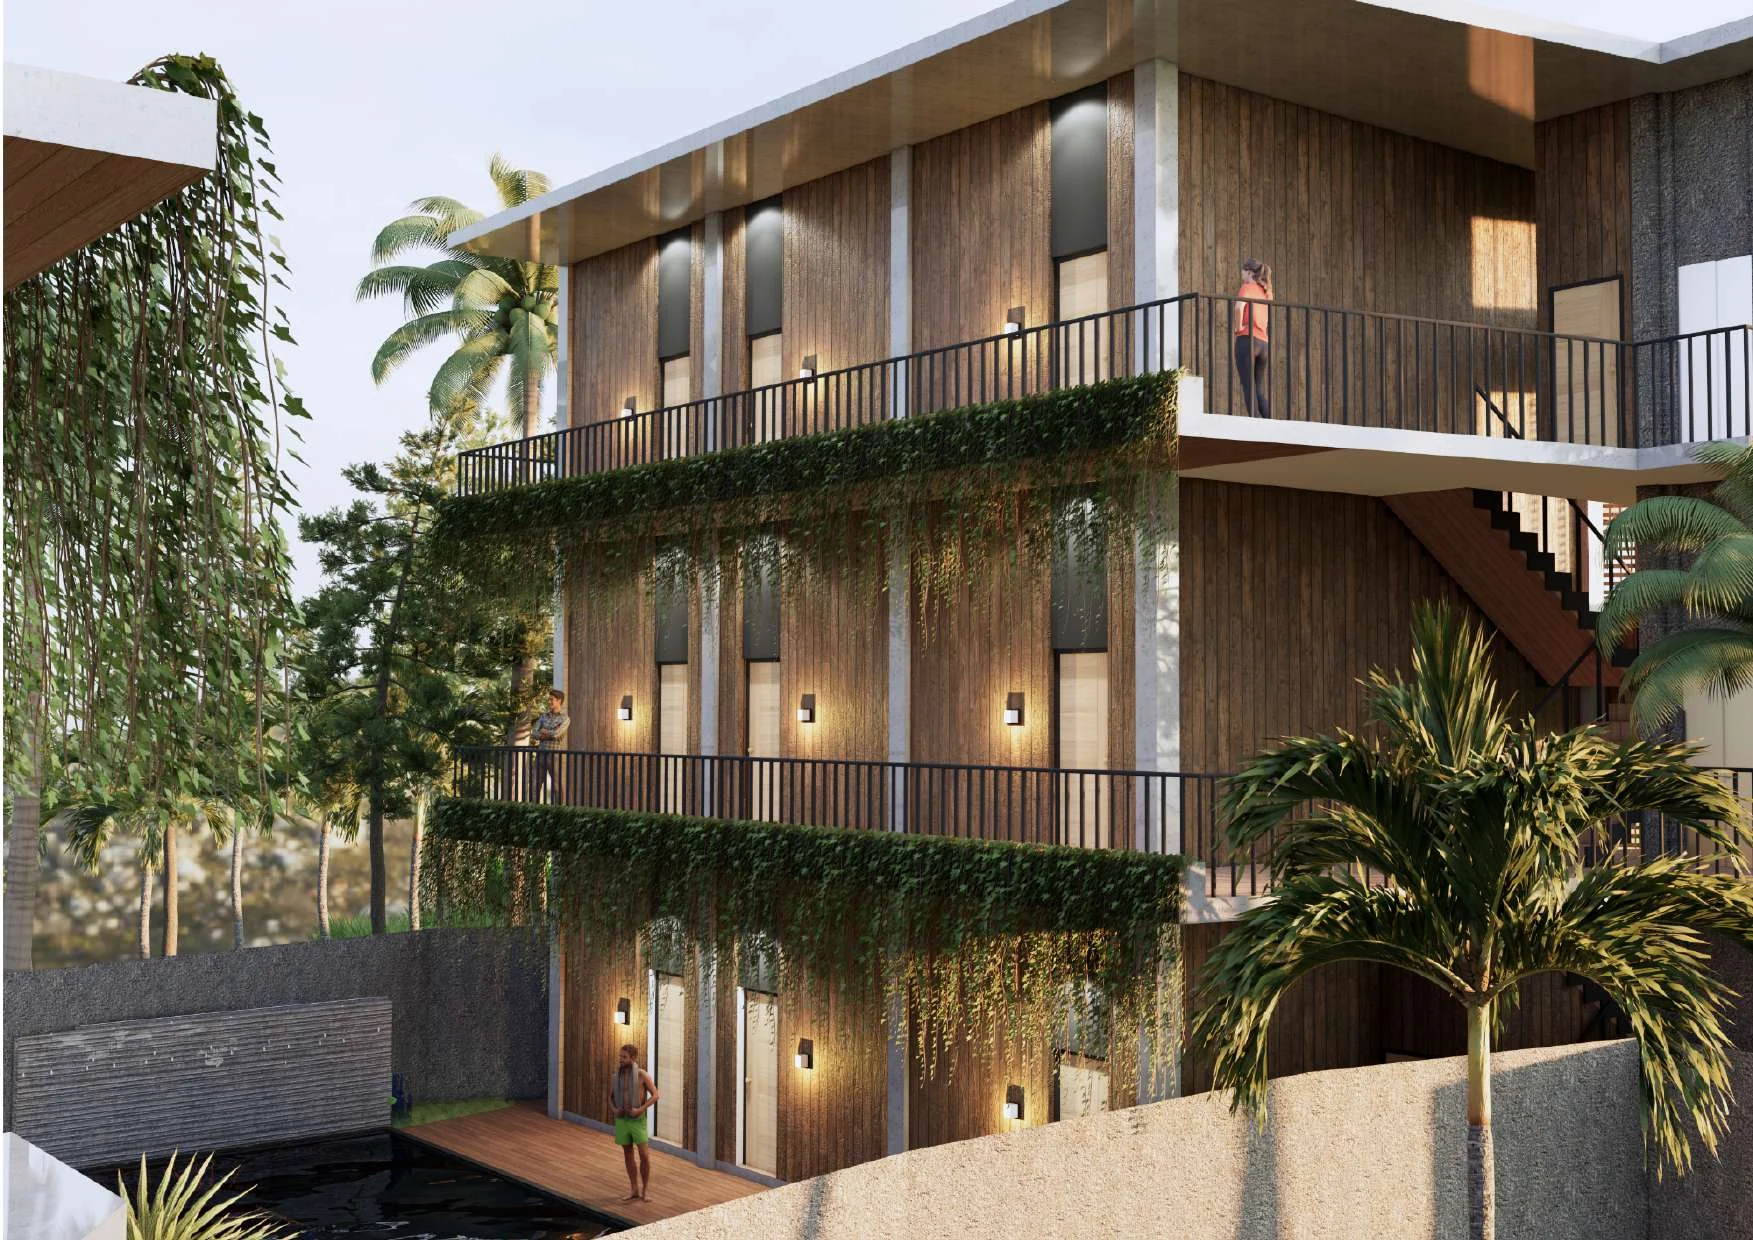
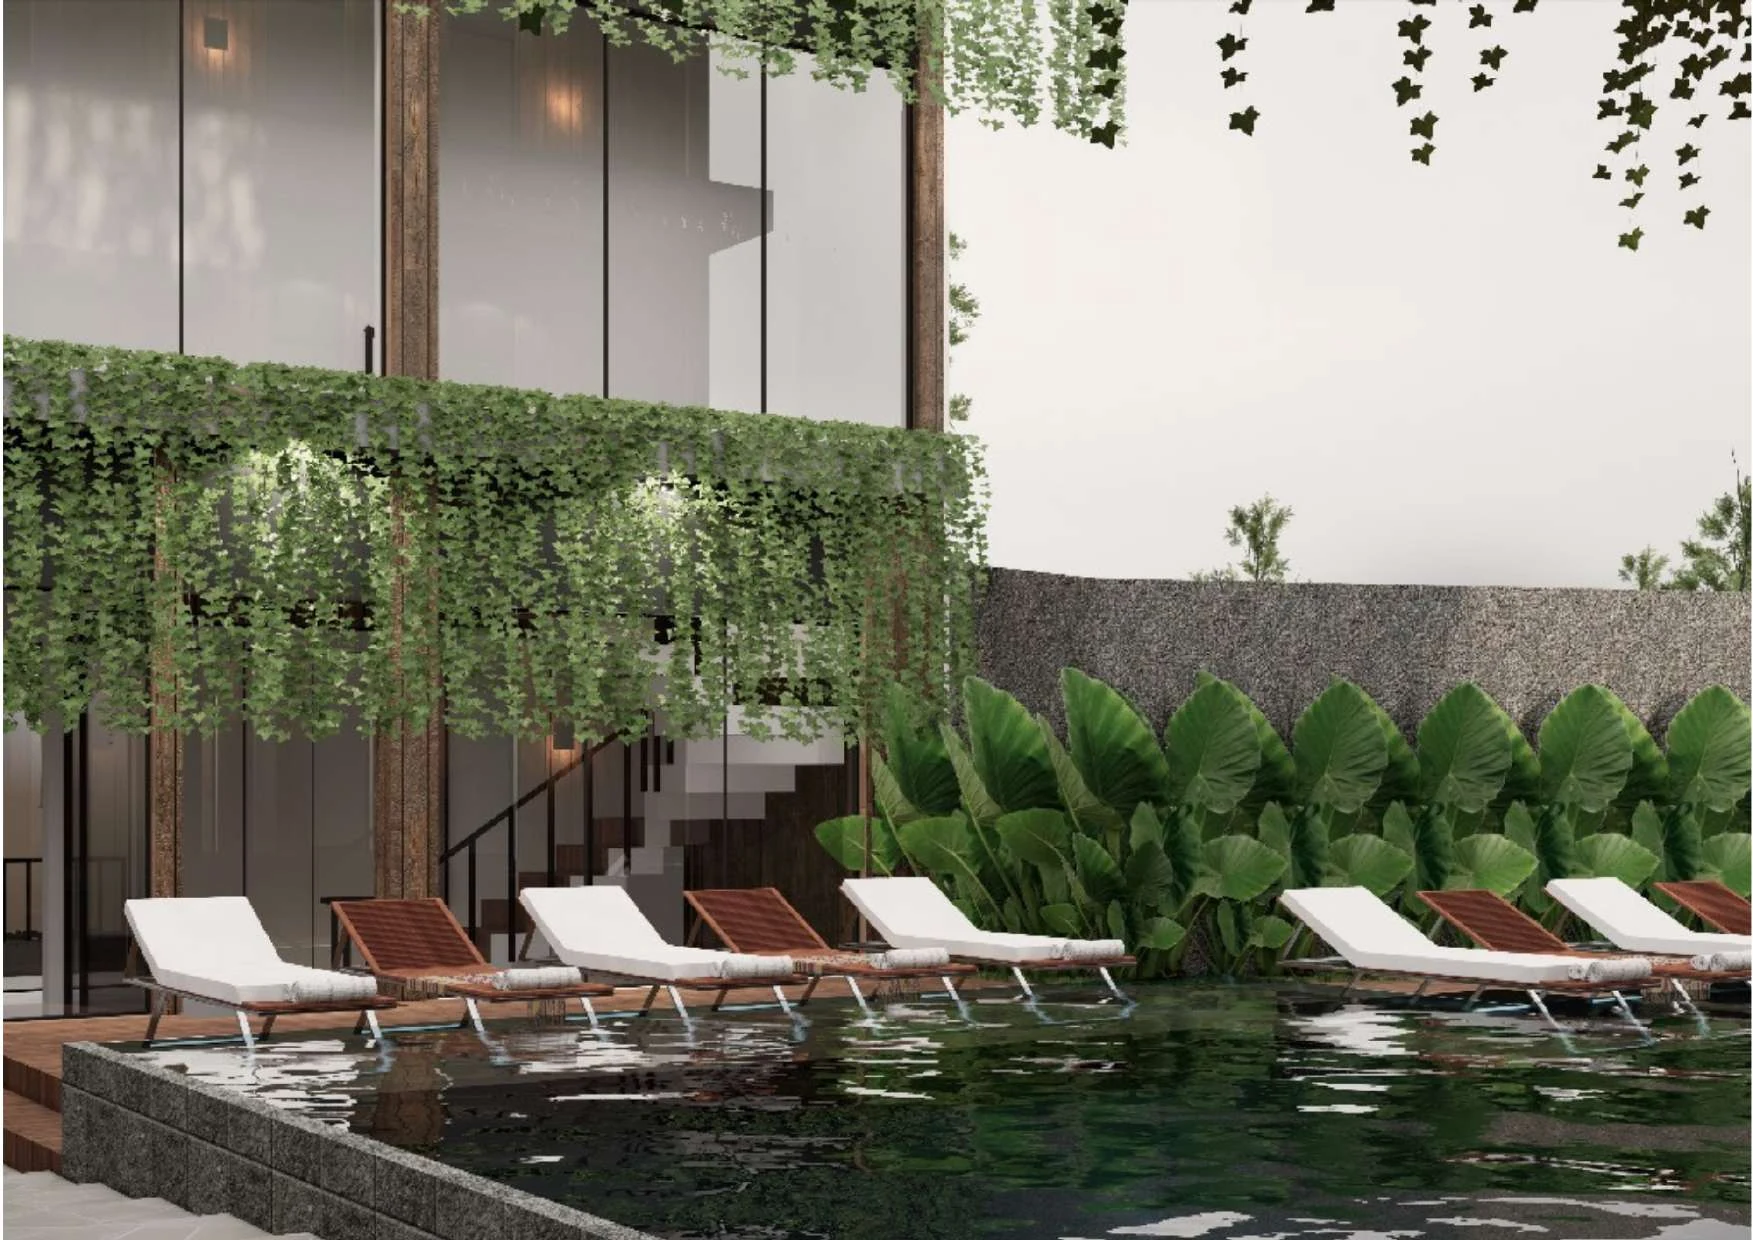
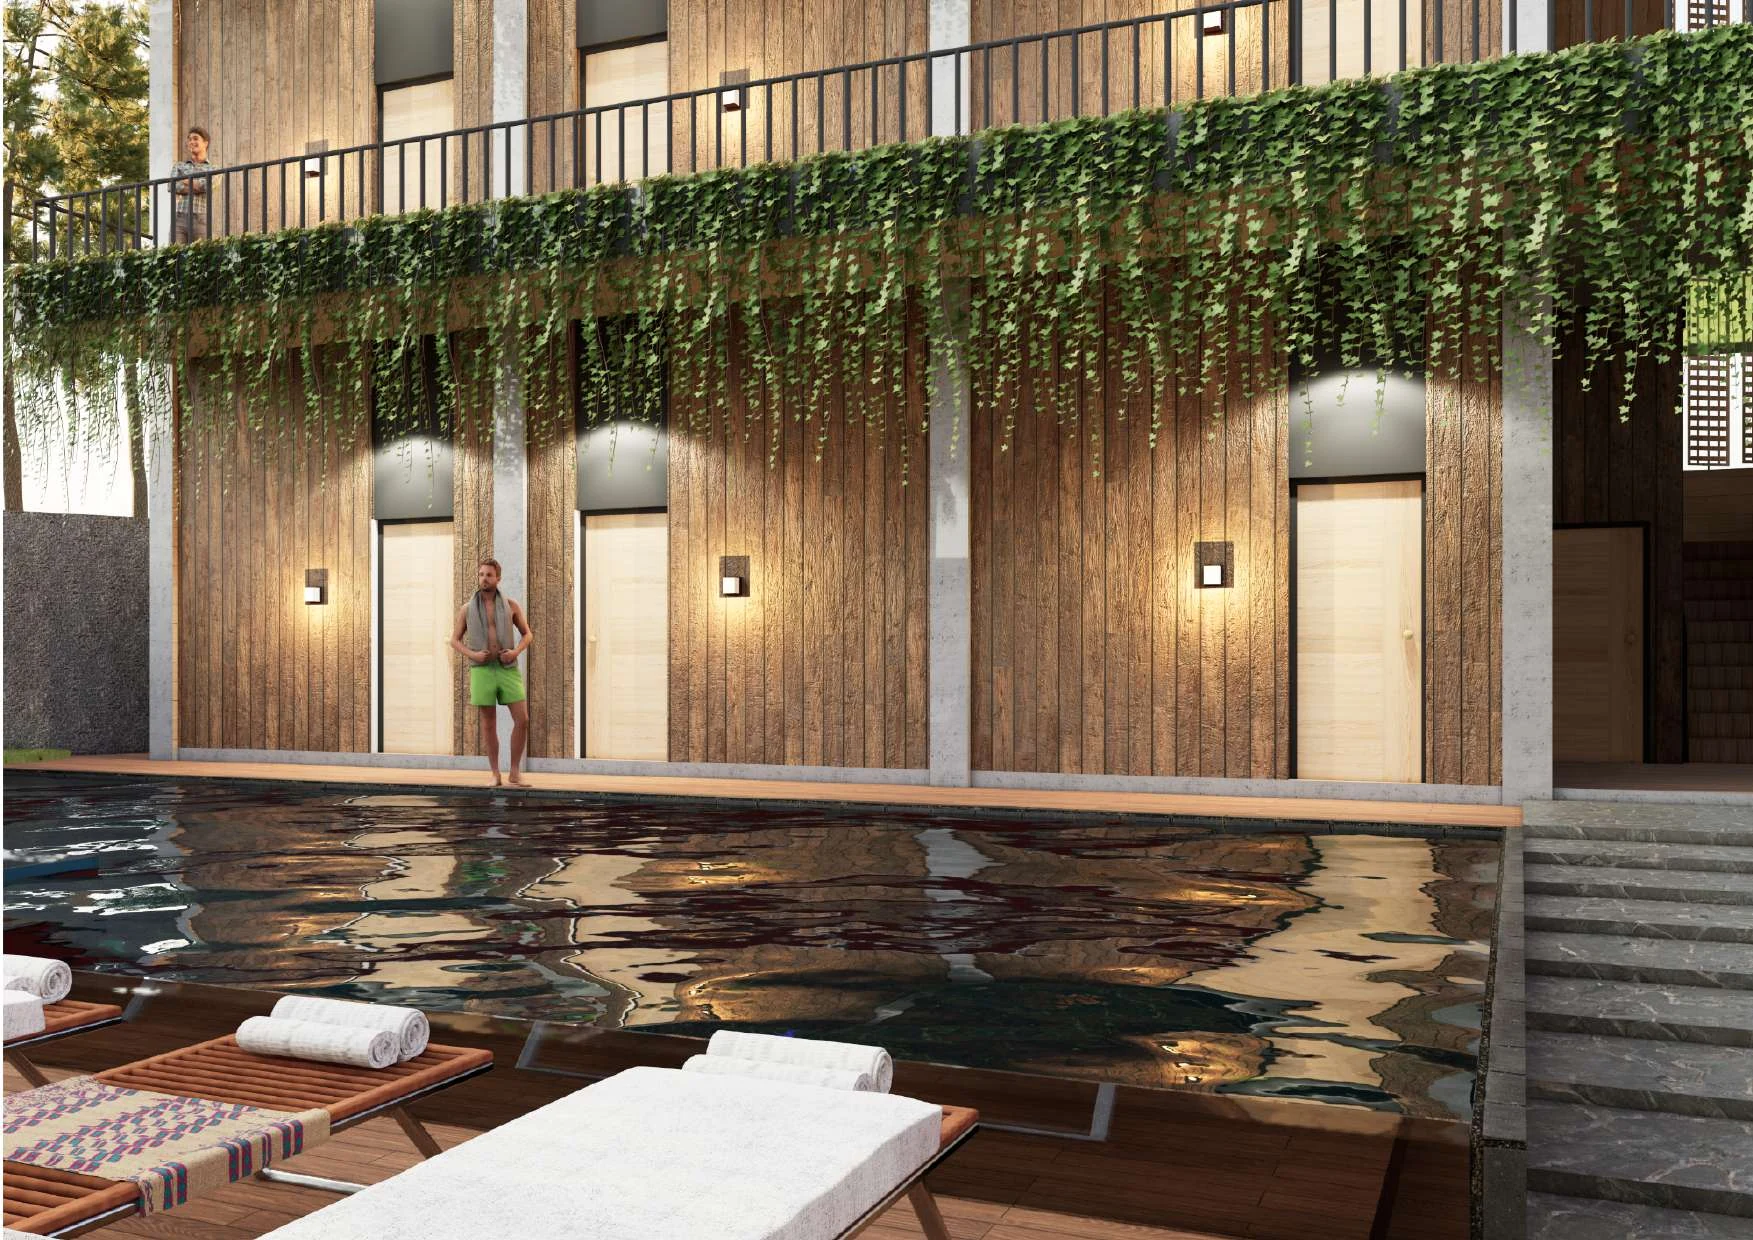
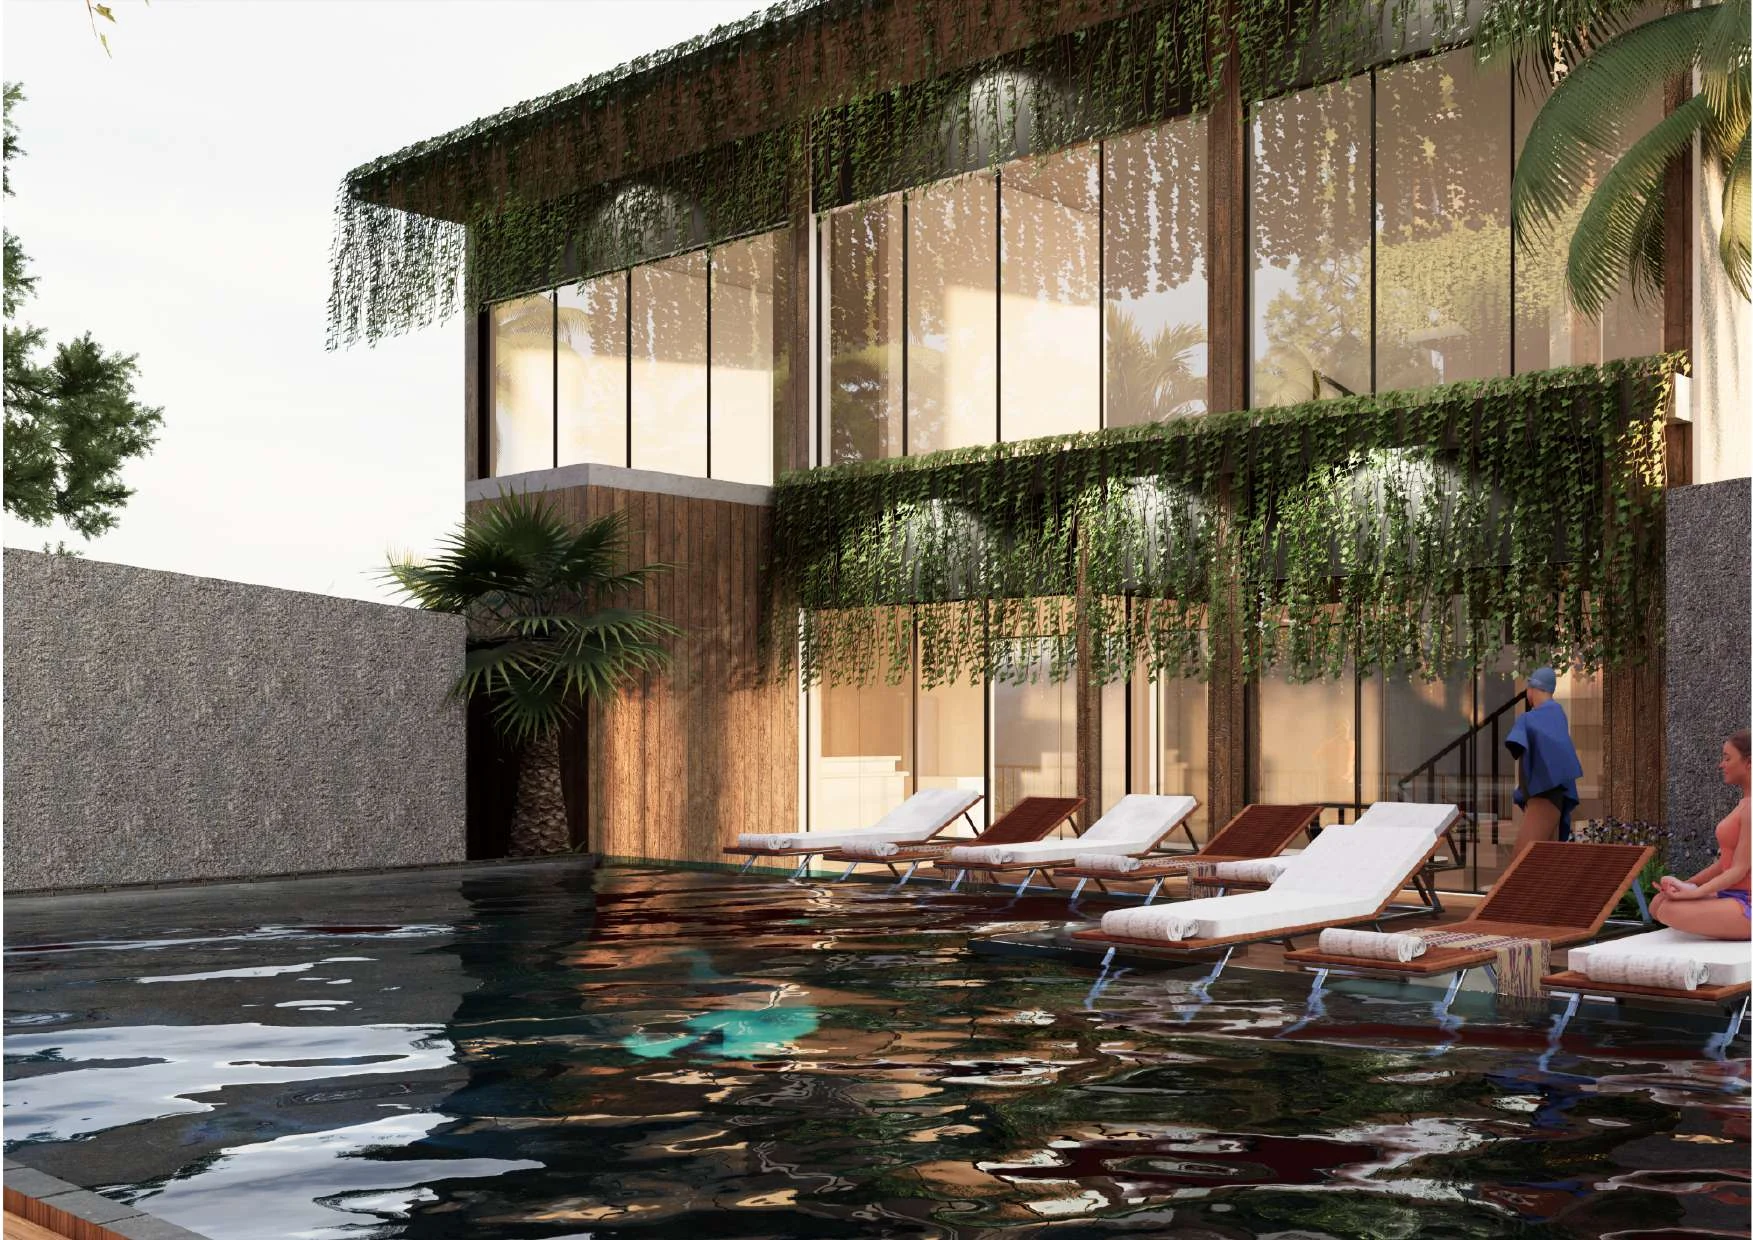
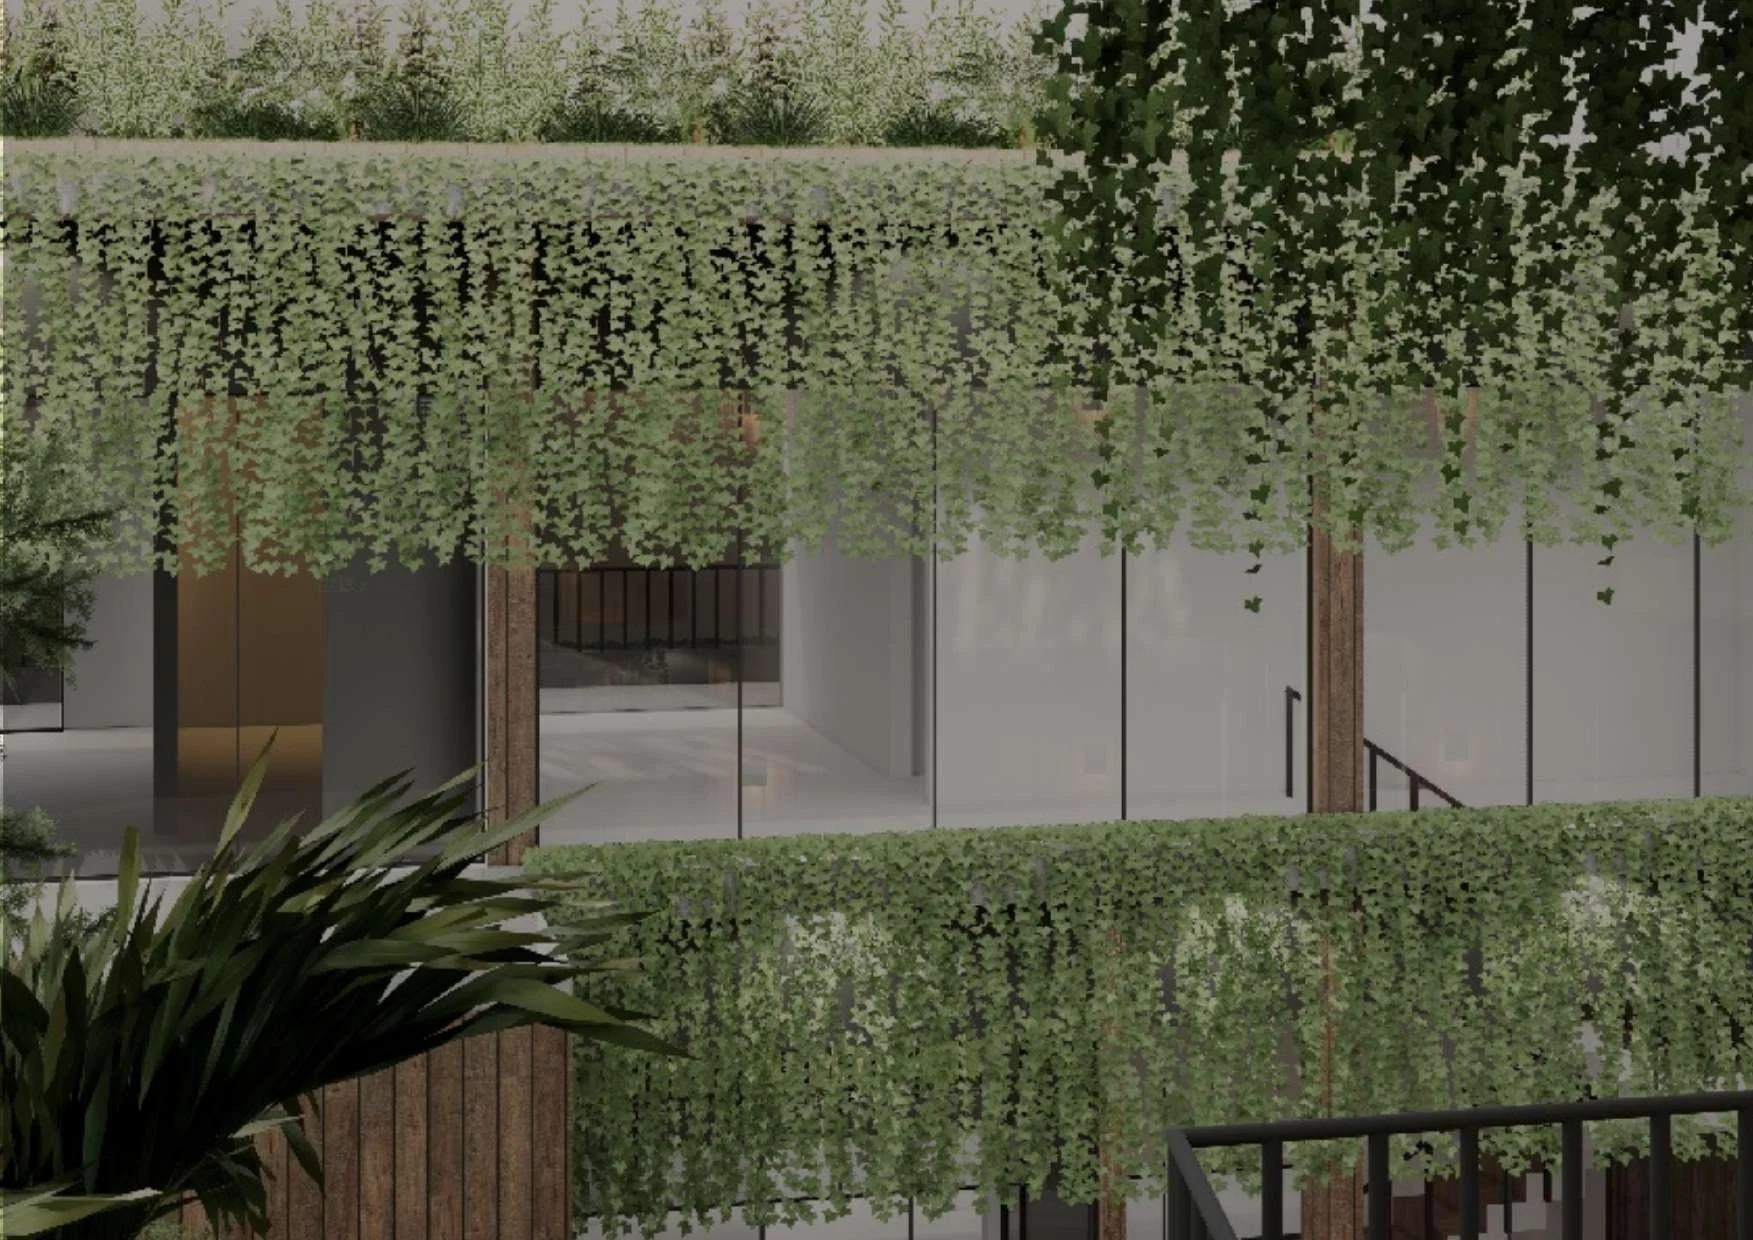
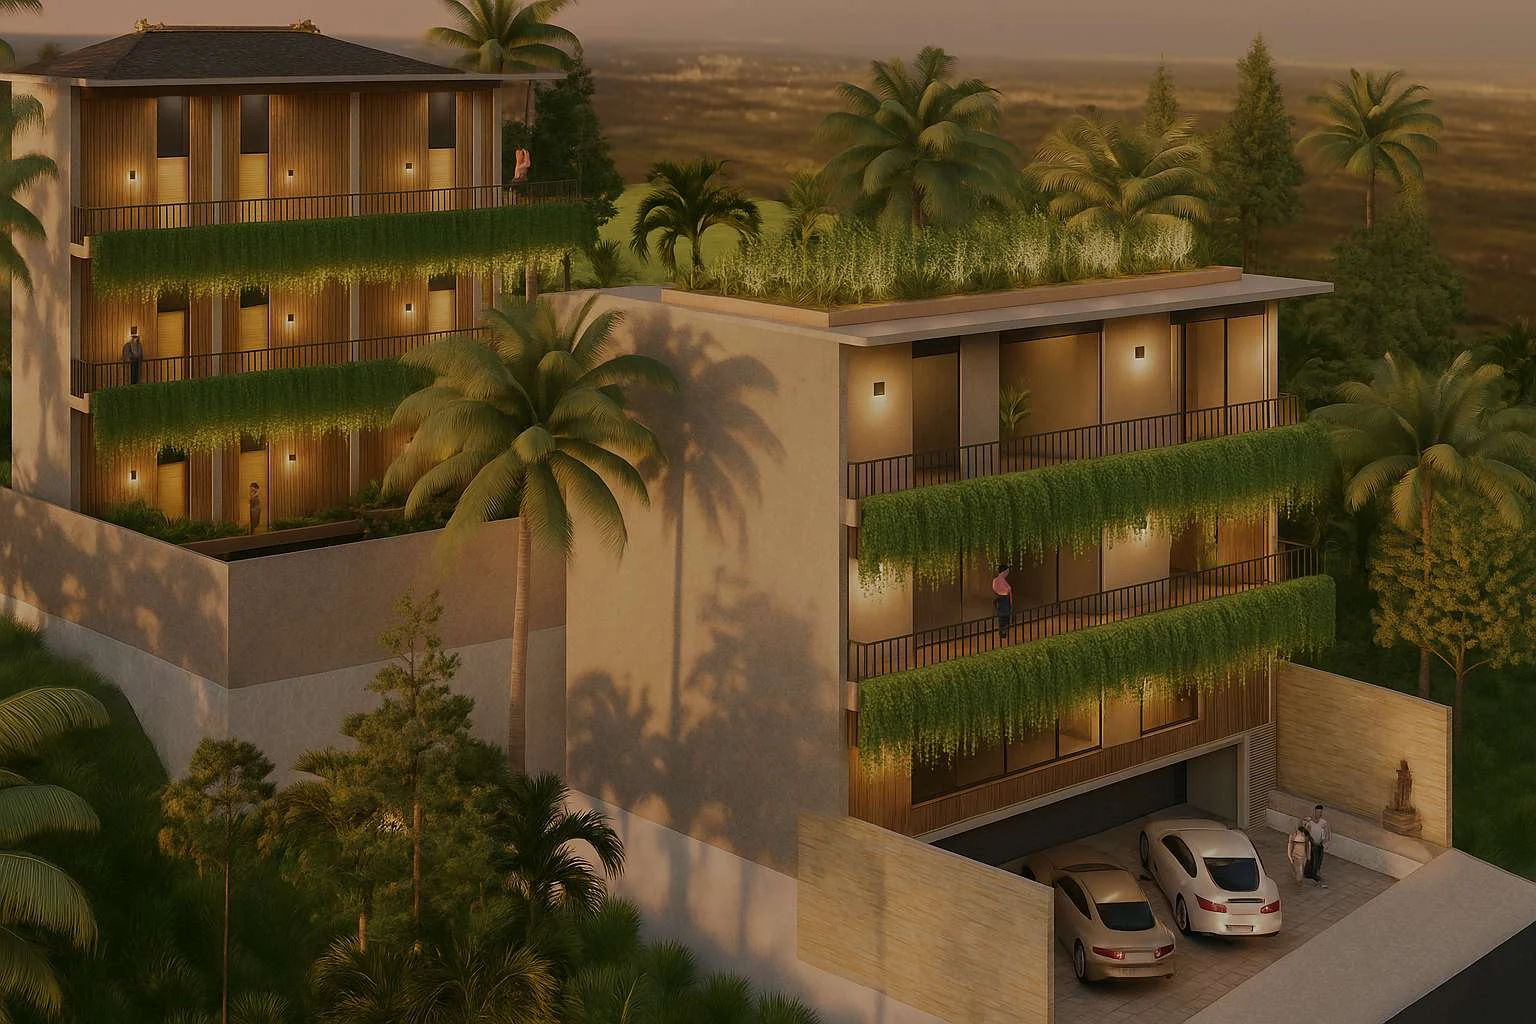
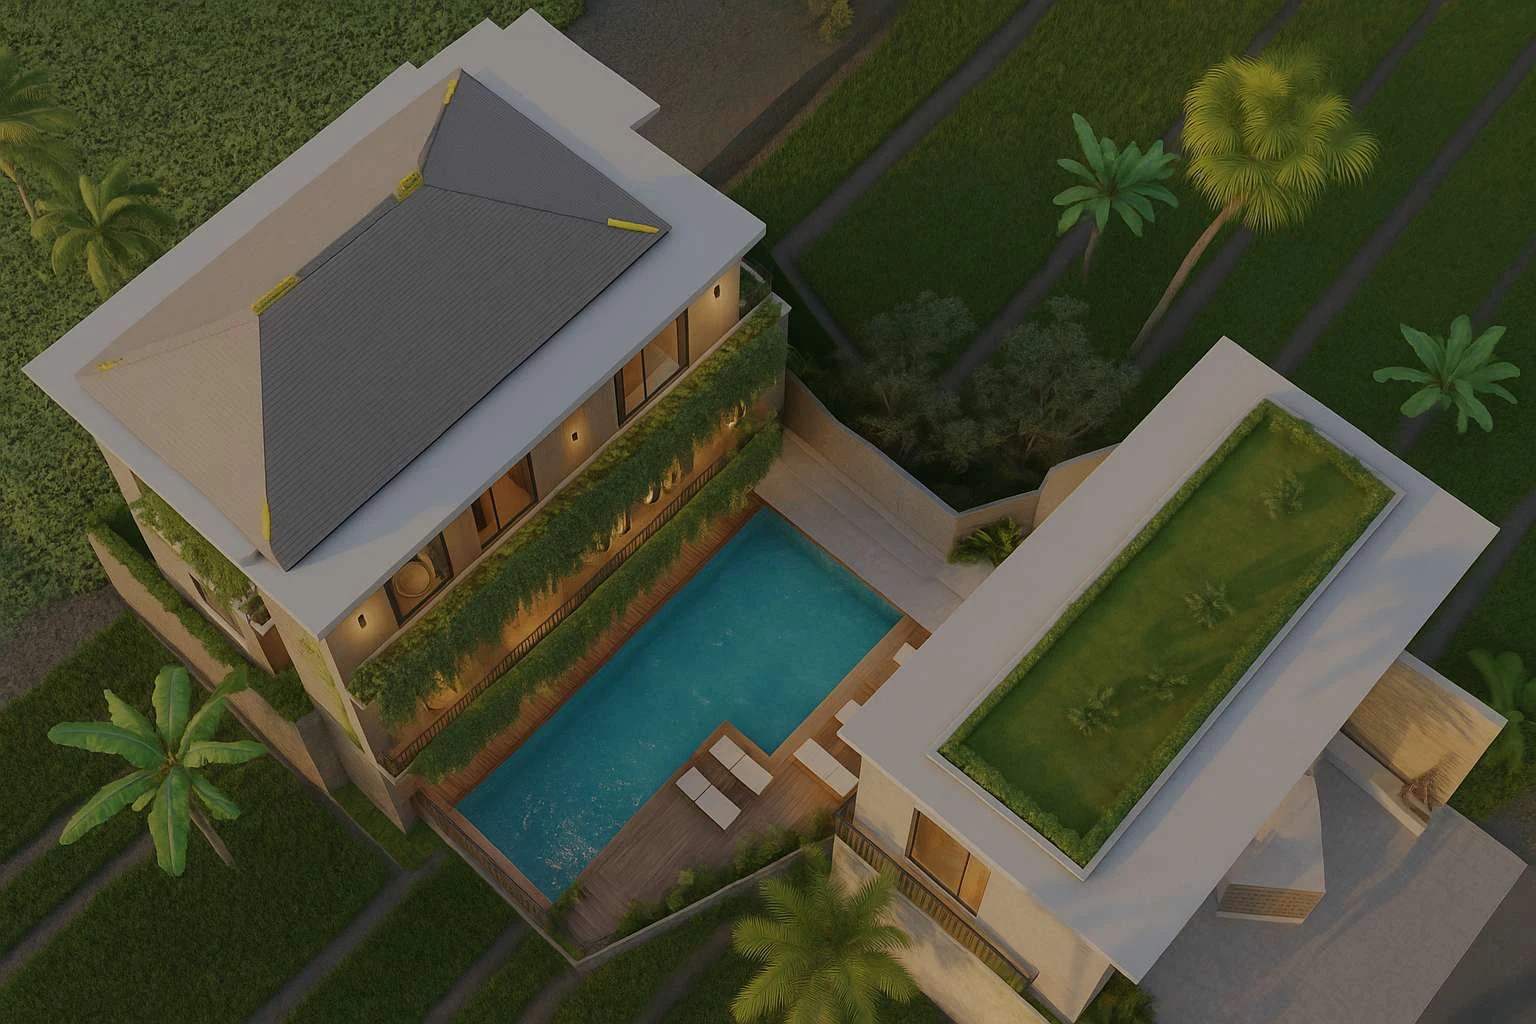
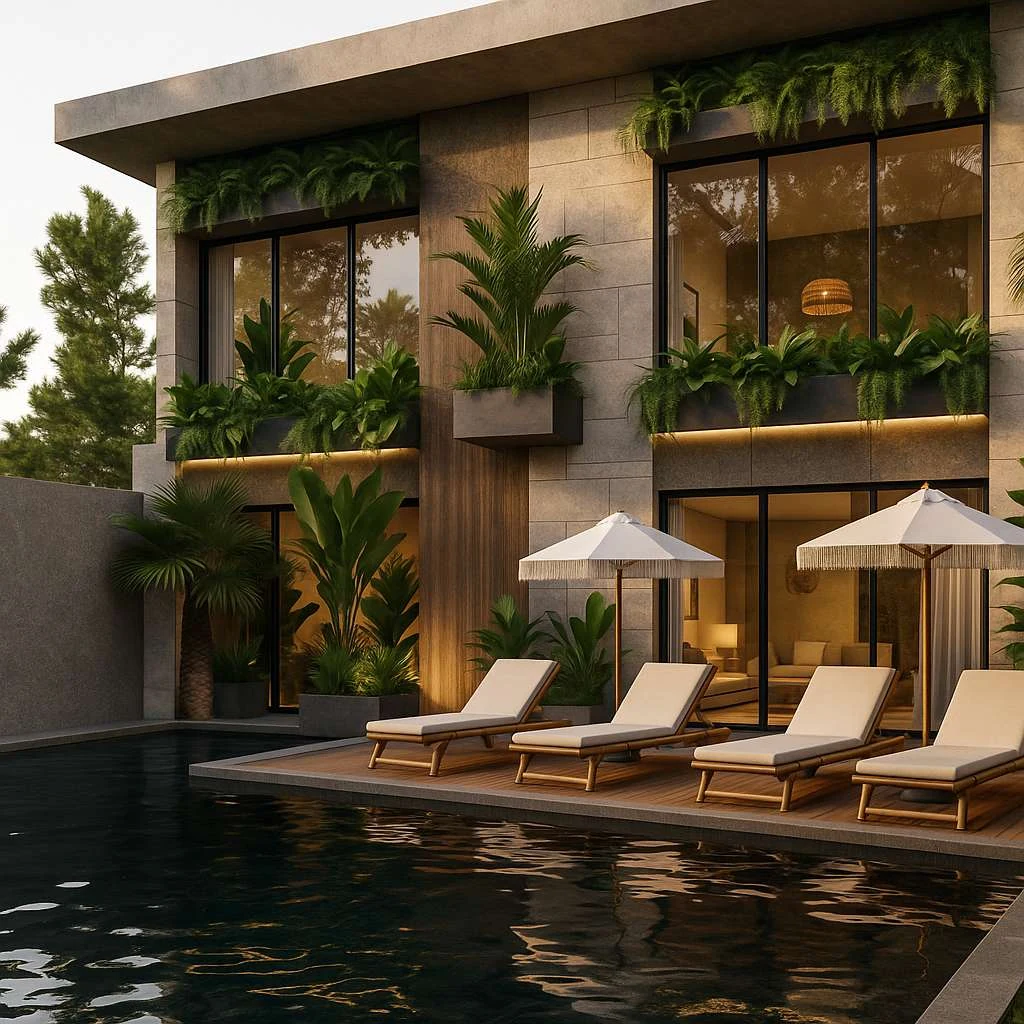
3D Architectural Renders
The following gallery presents the three-dimensional architectural vision for Tevah Suite Ubud — capturing the boutique eco-luxury aesthetic, spatial flow, and design language of the development.

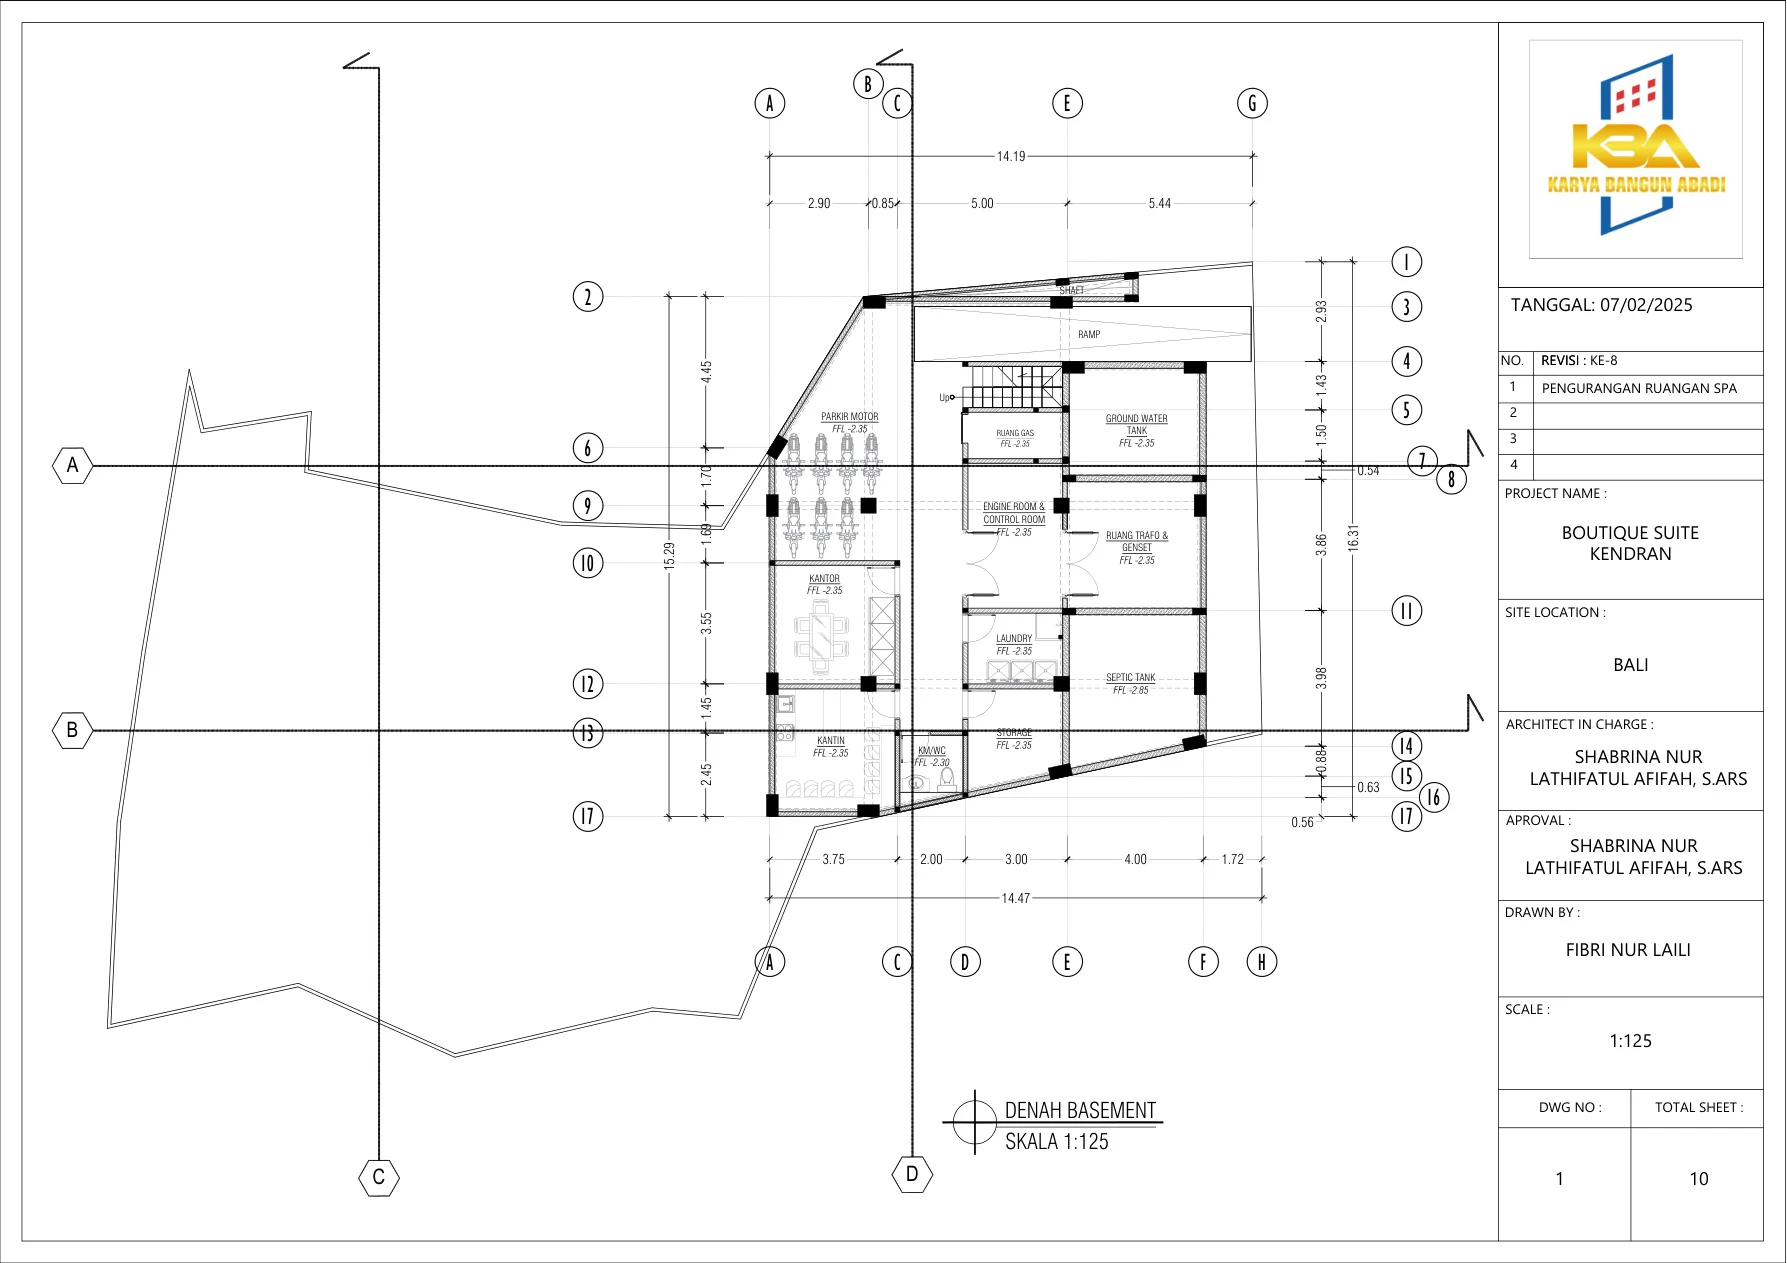
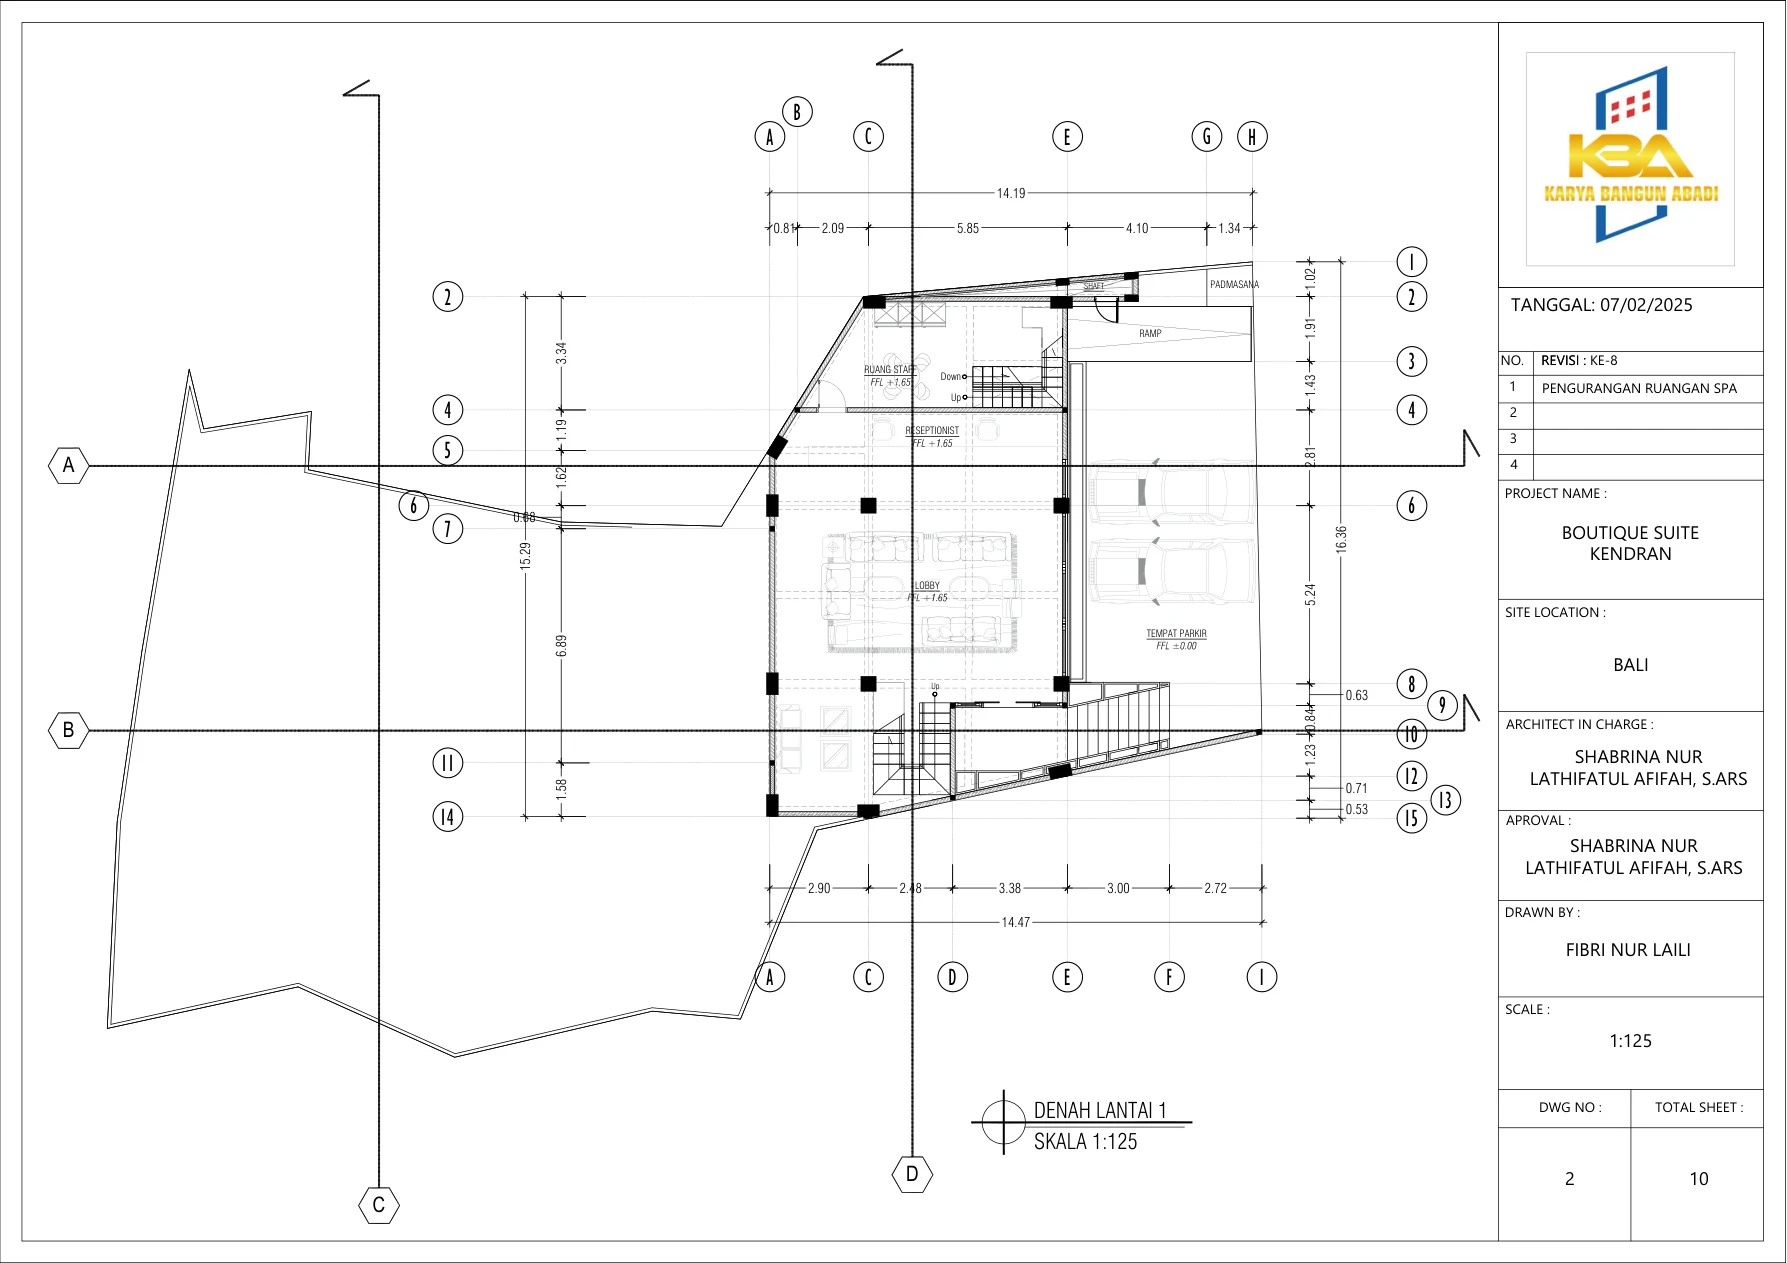
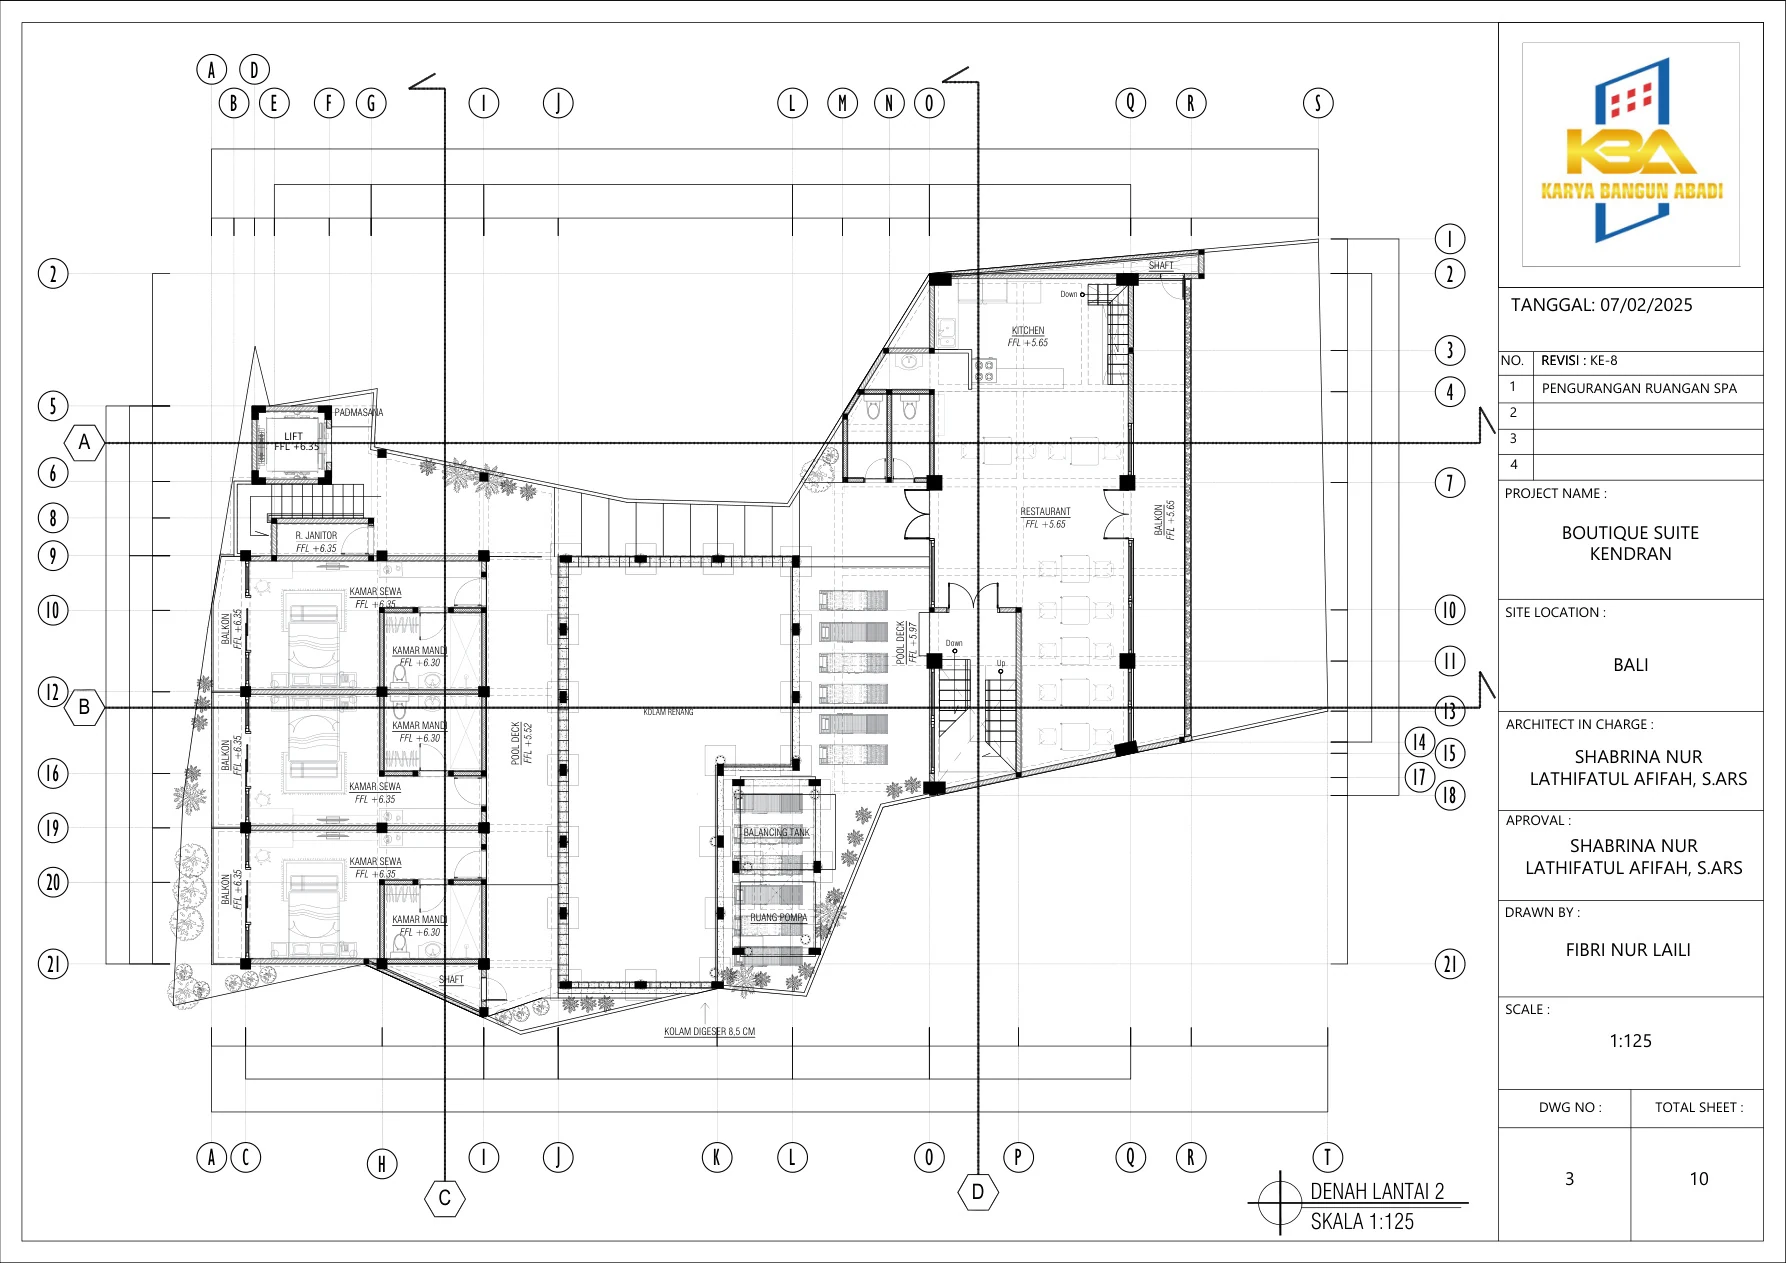
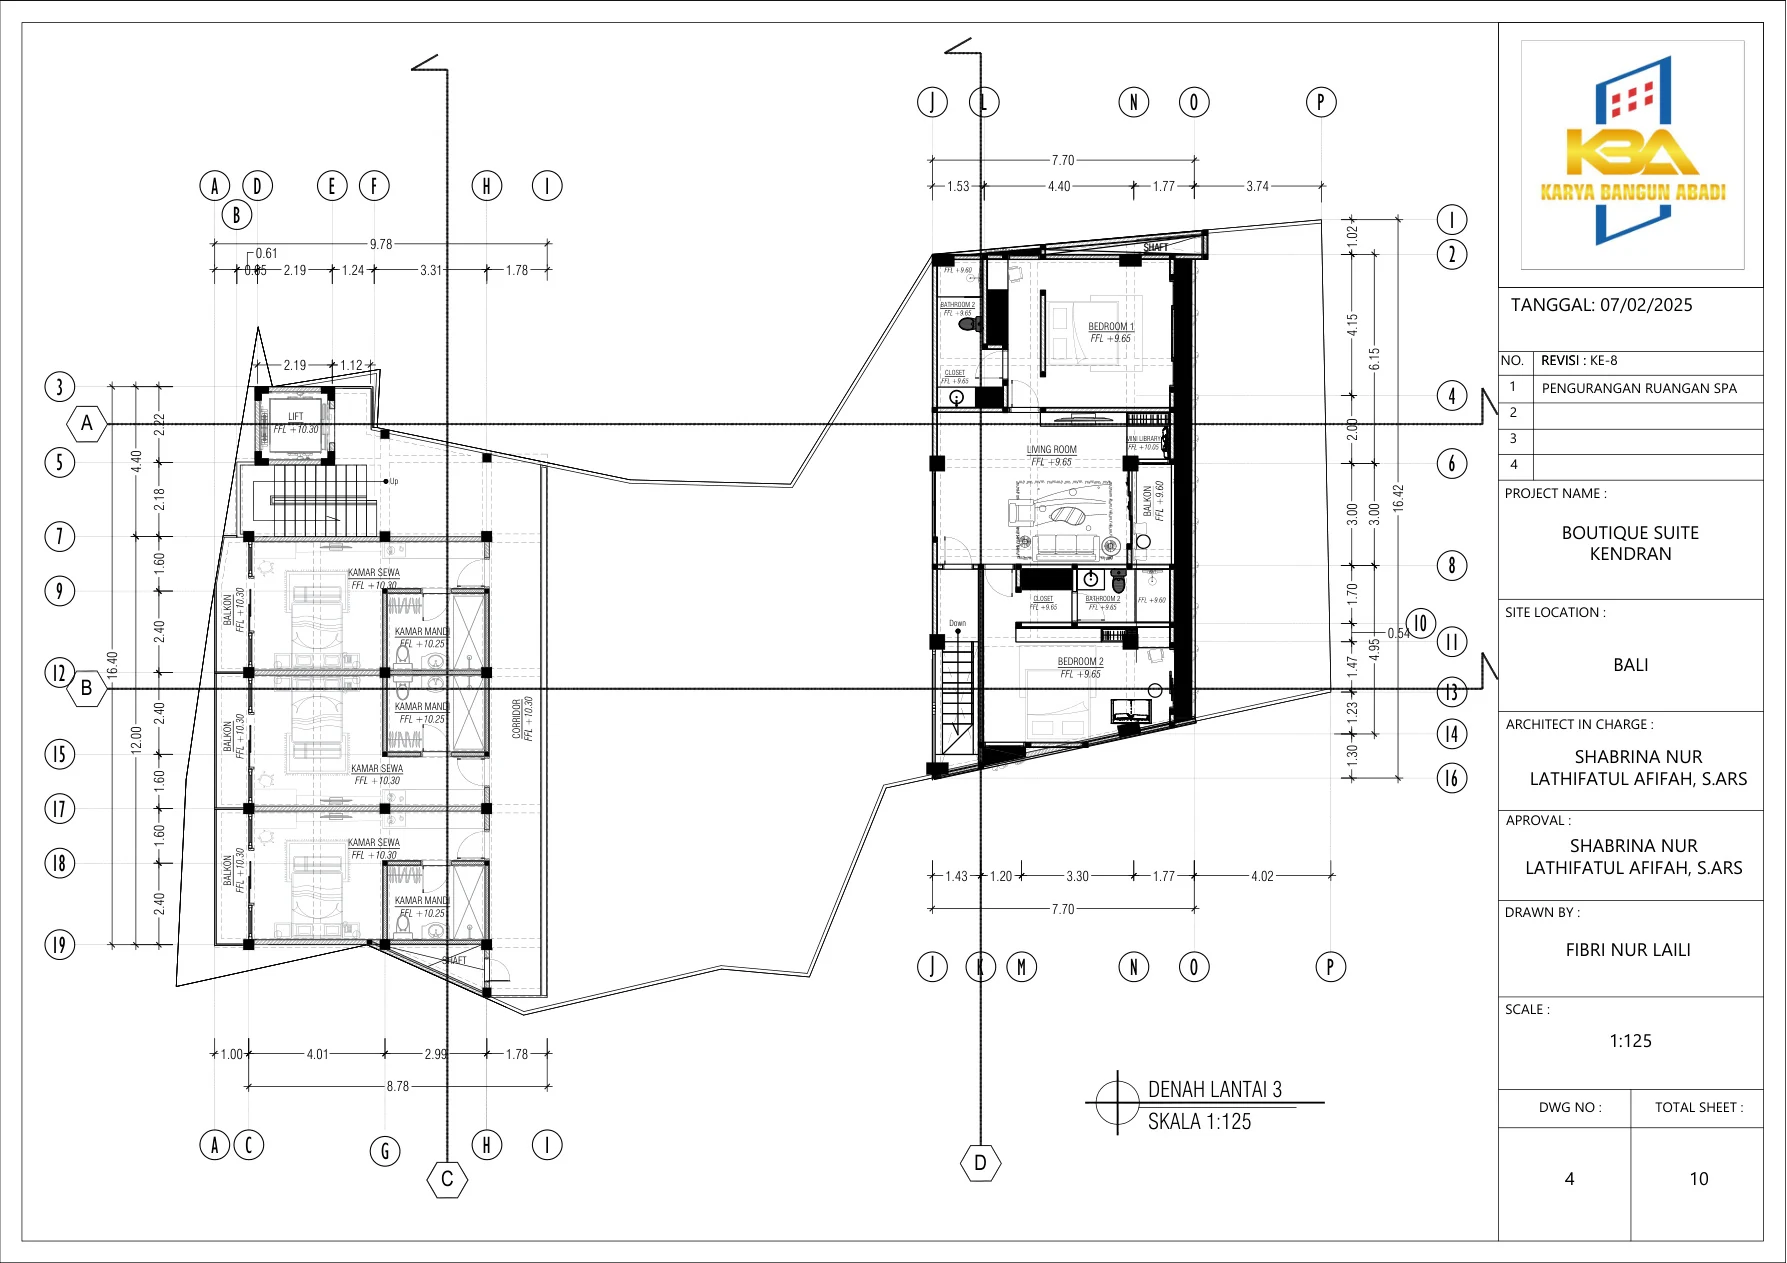
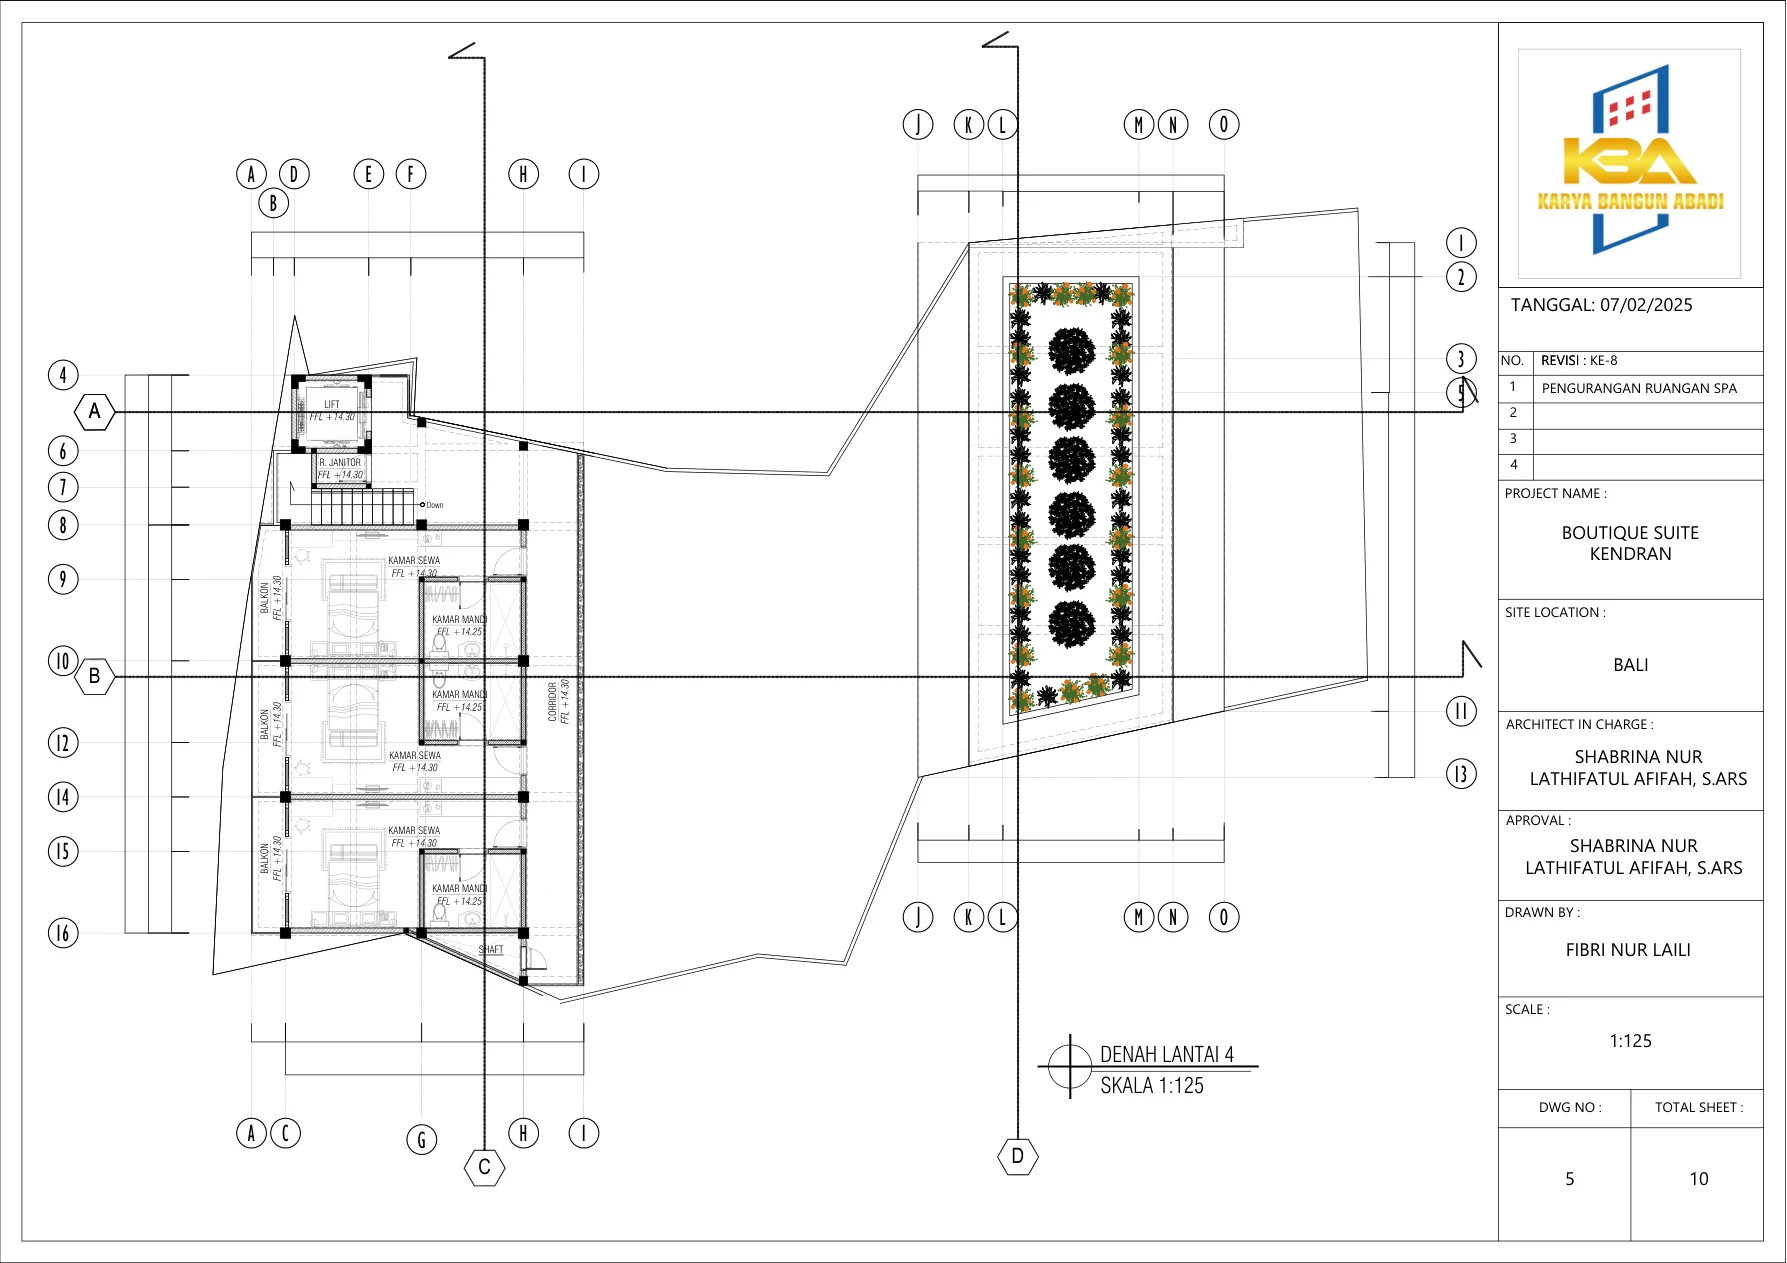
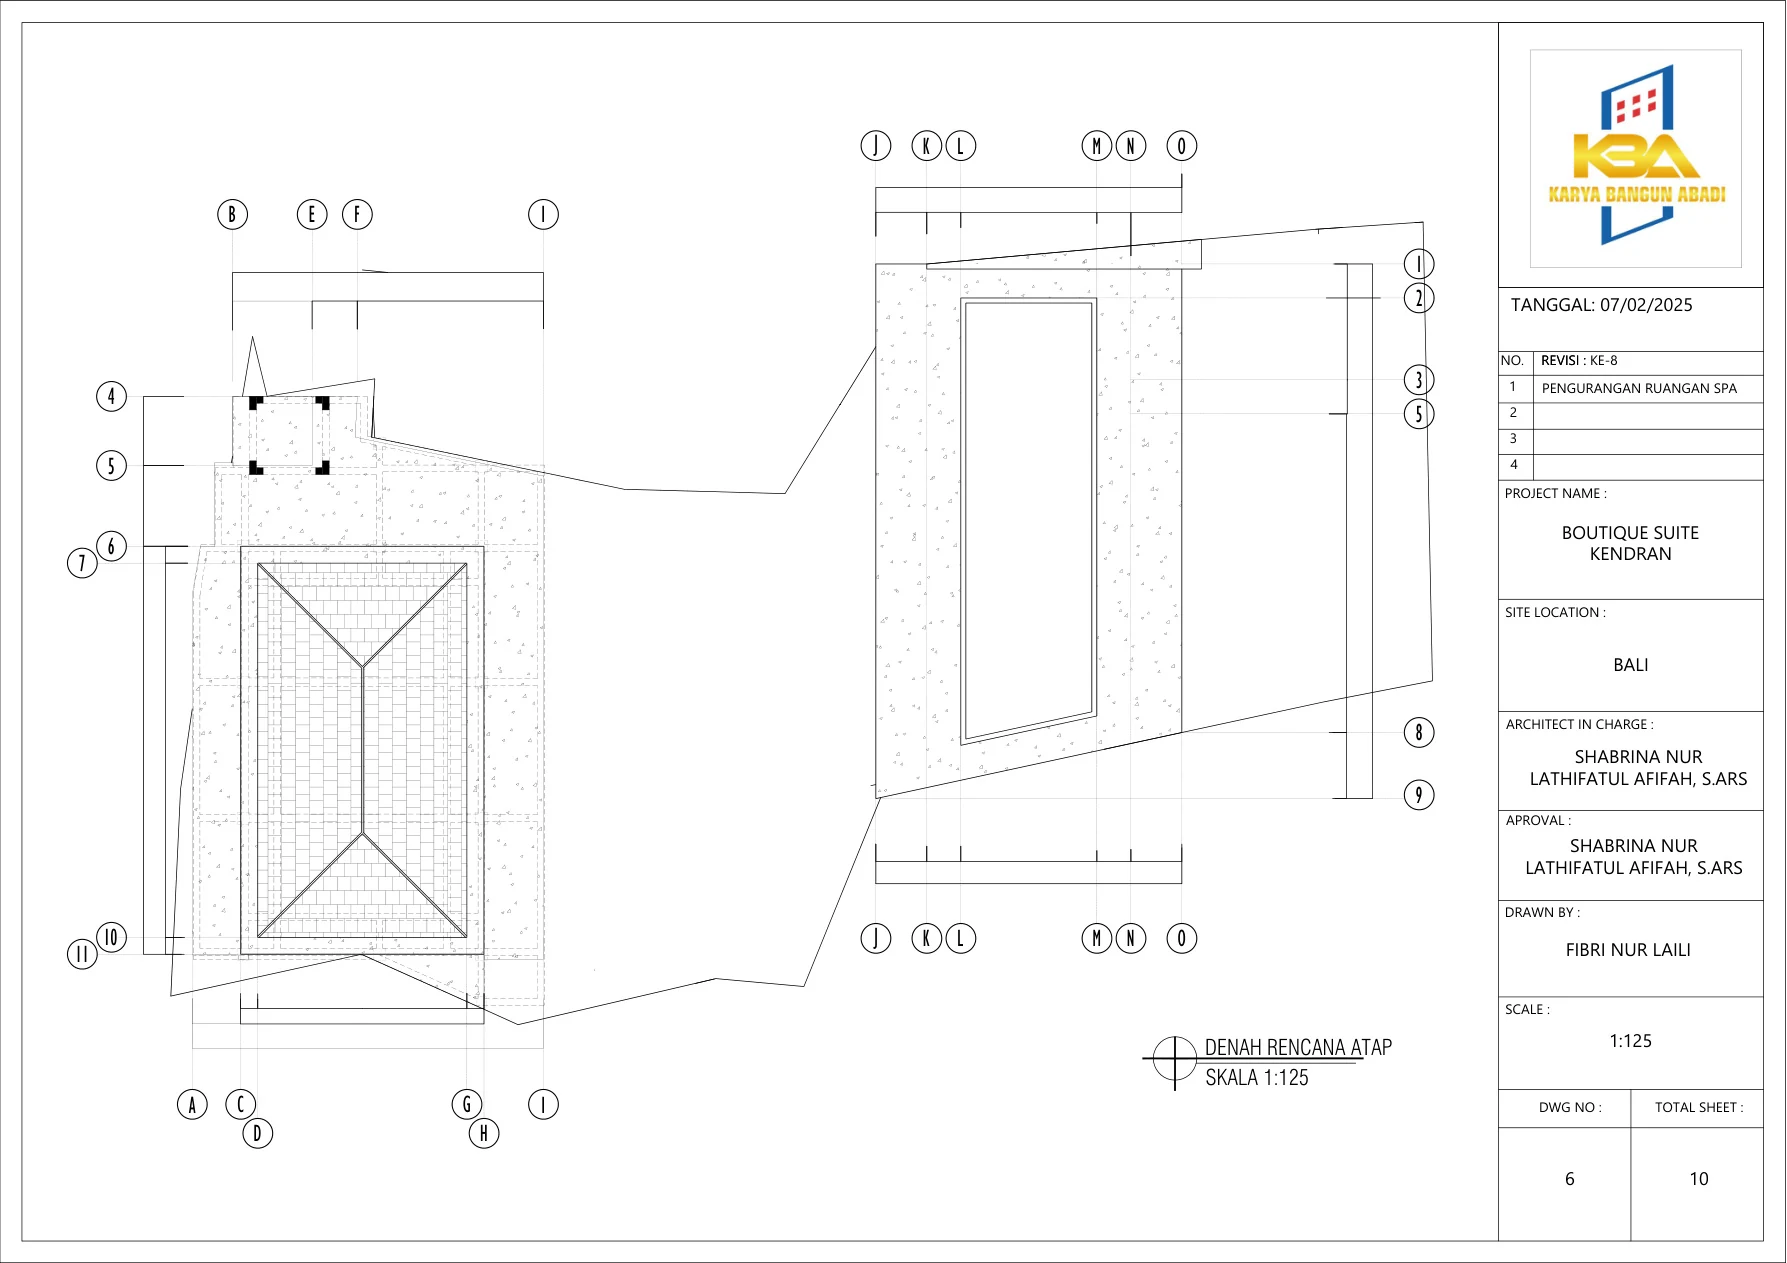
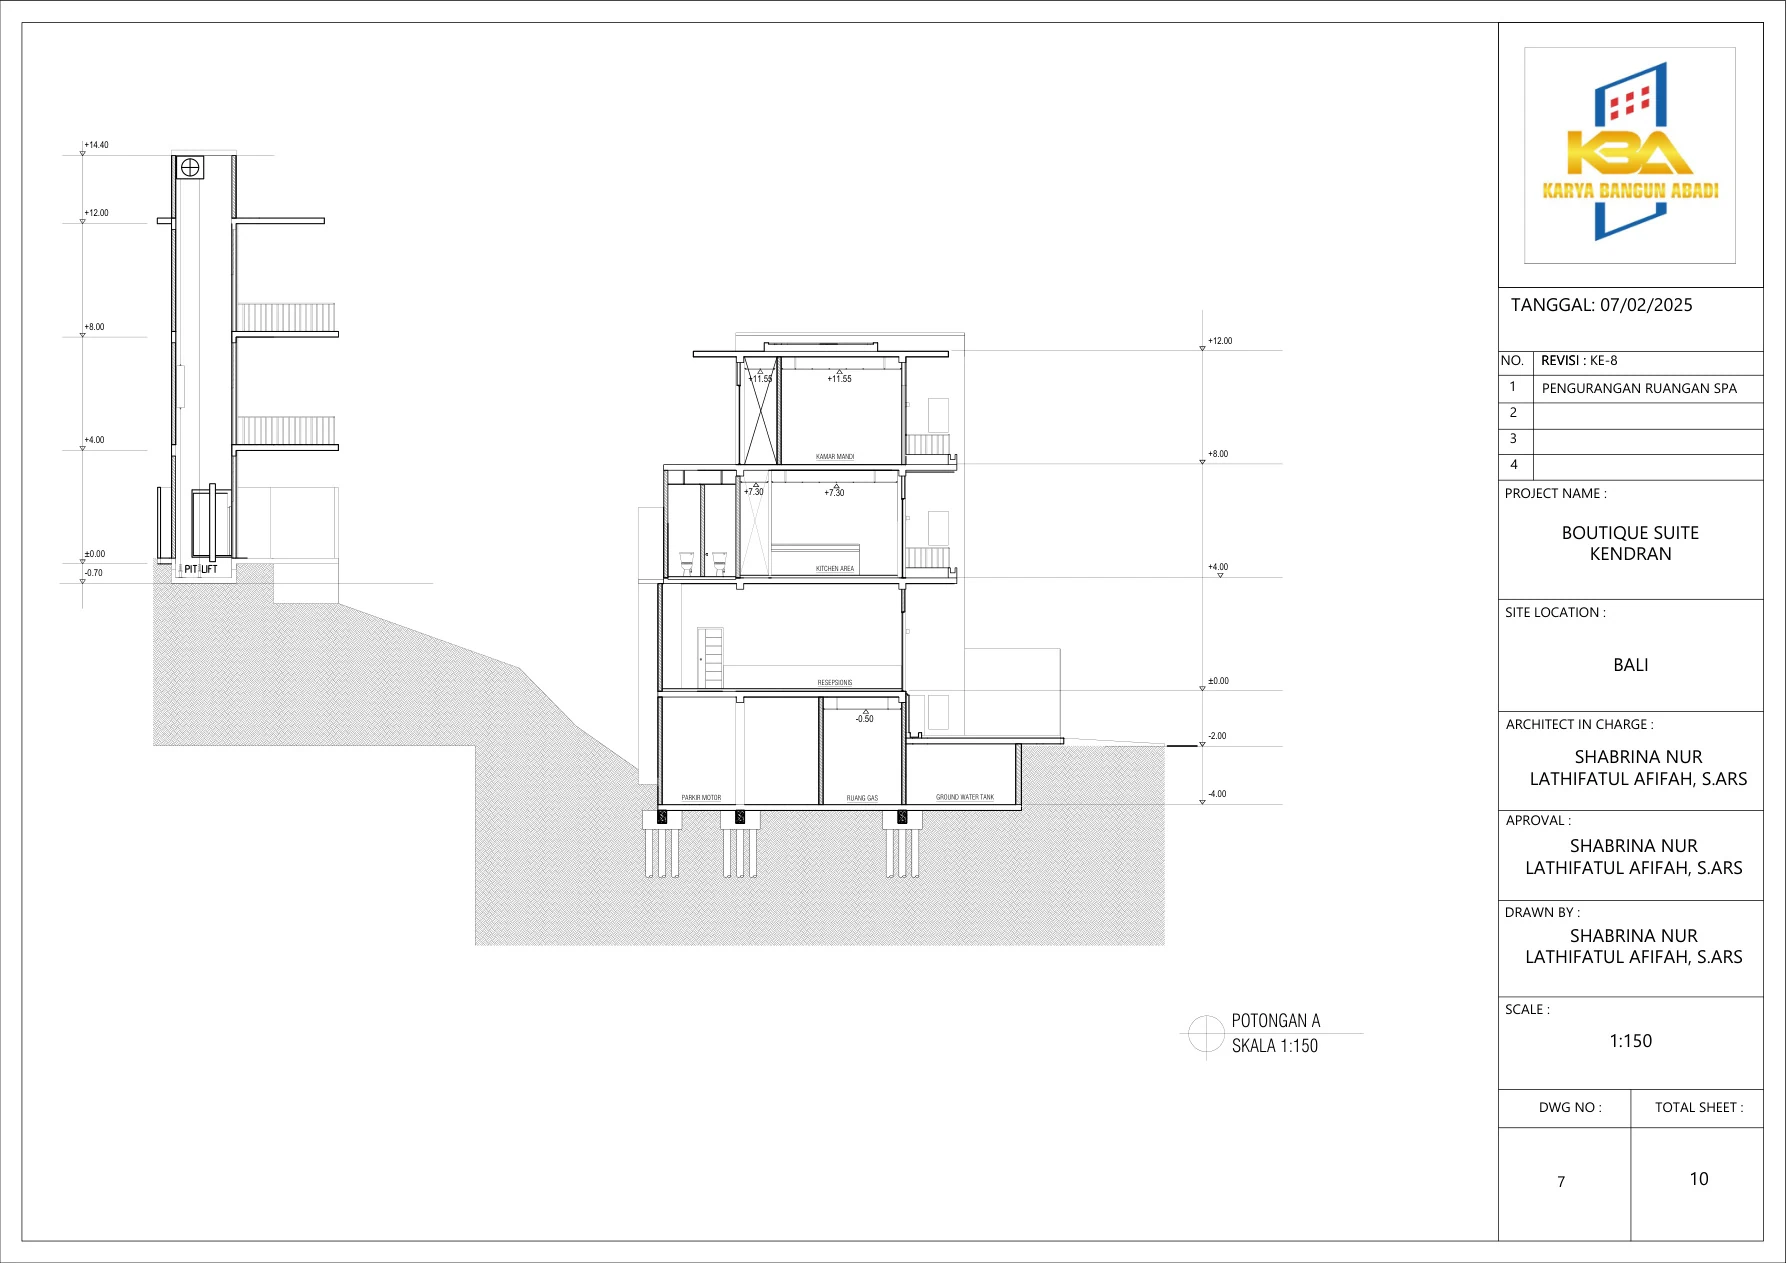
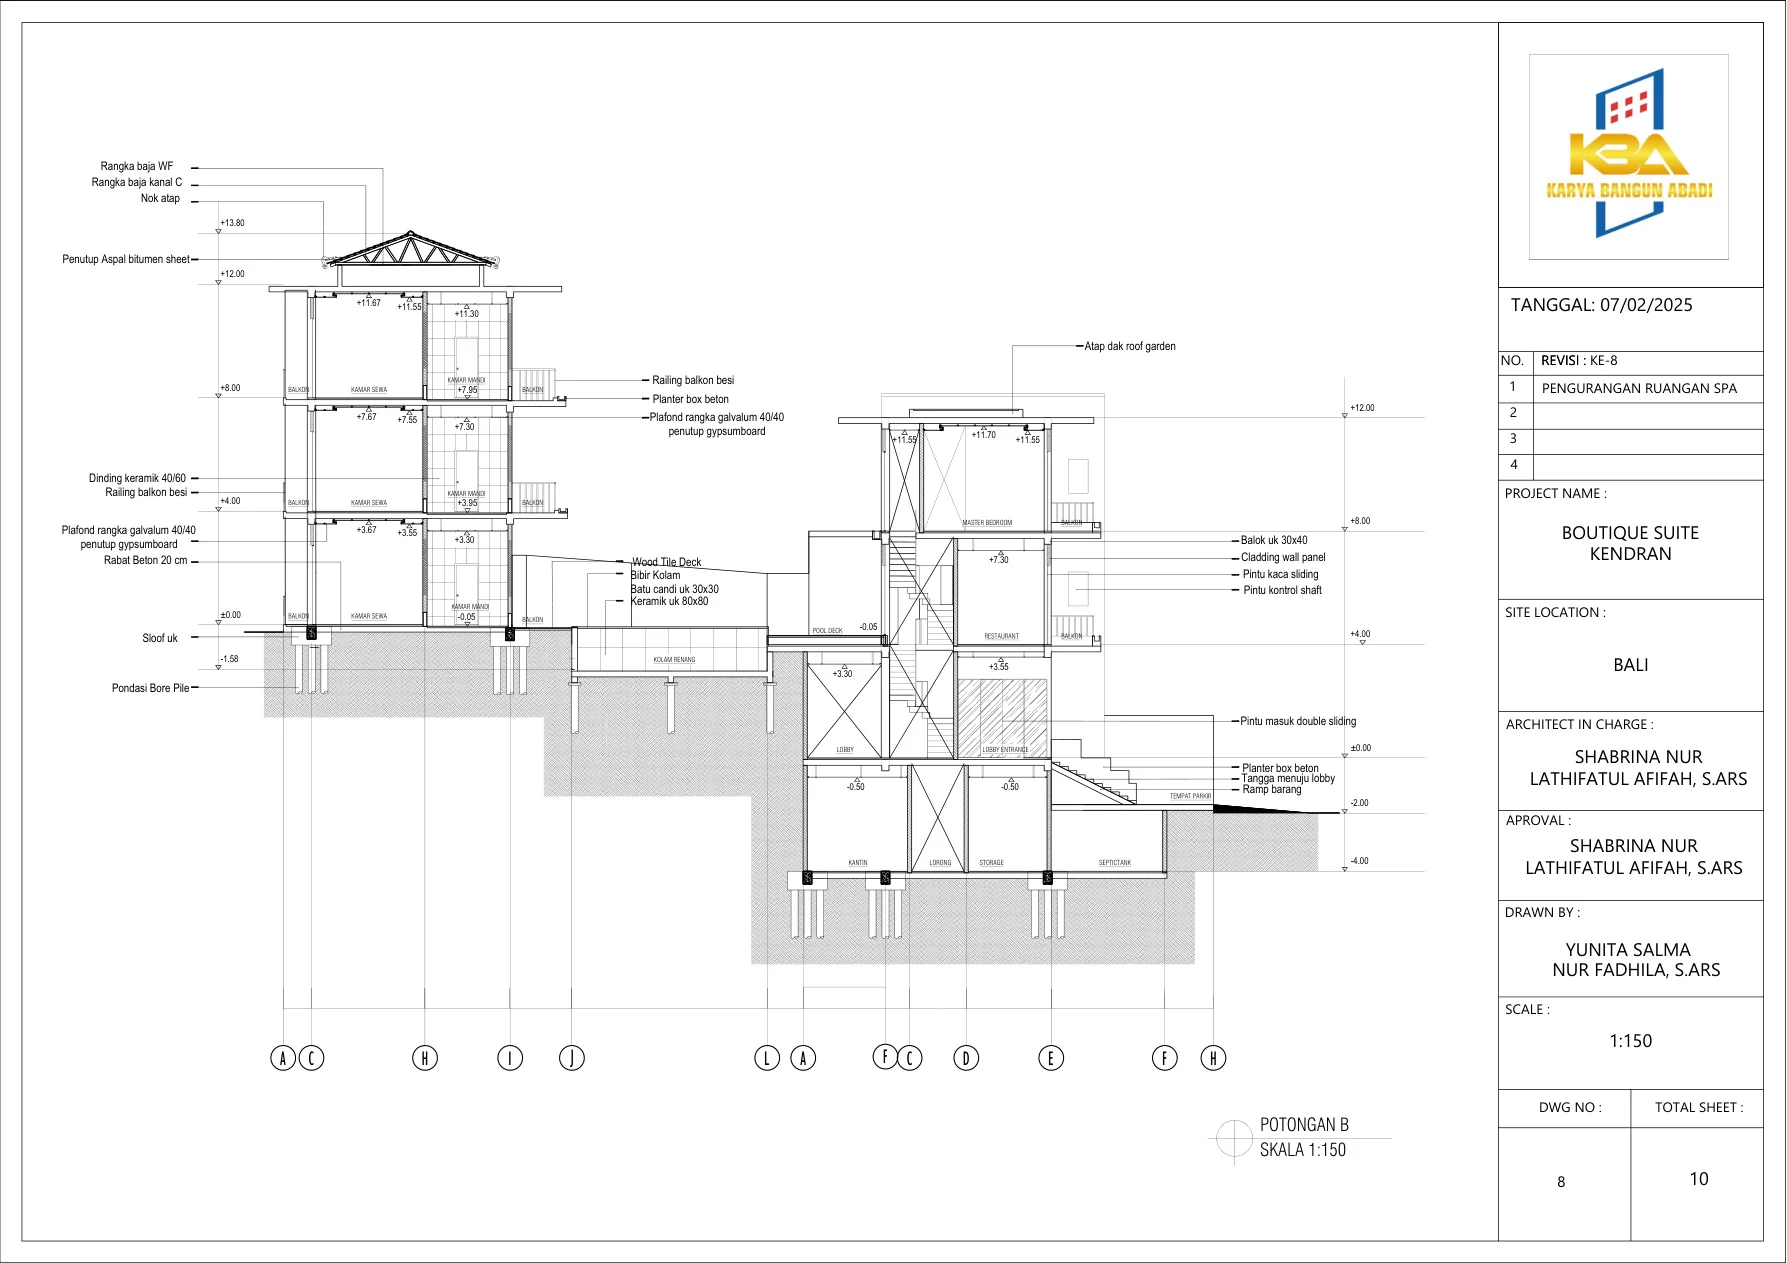
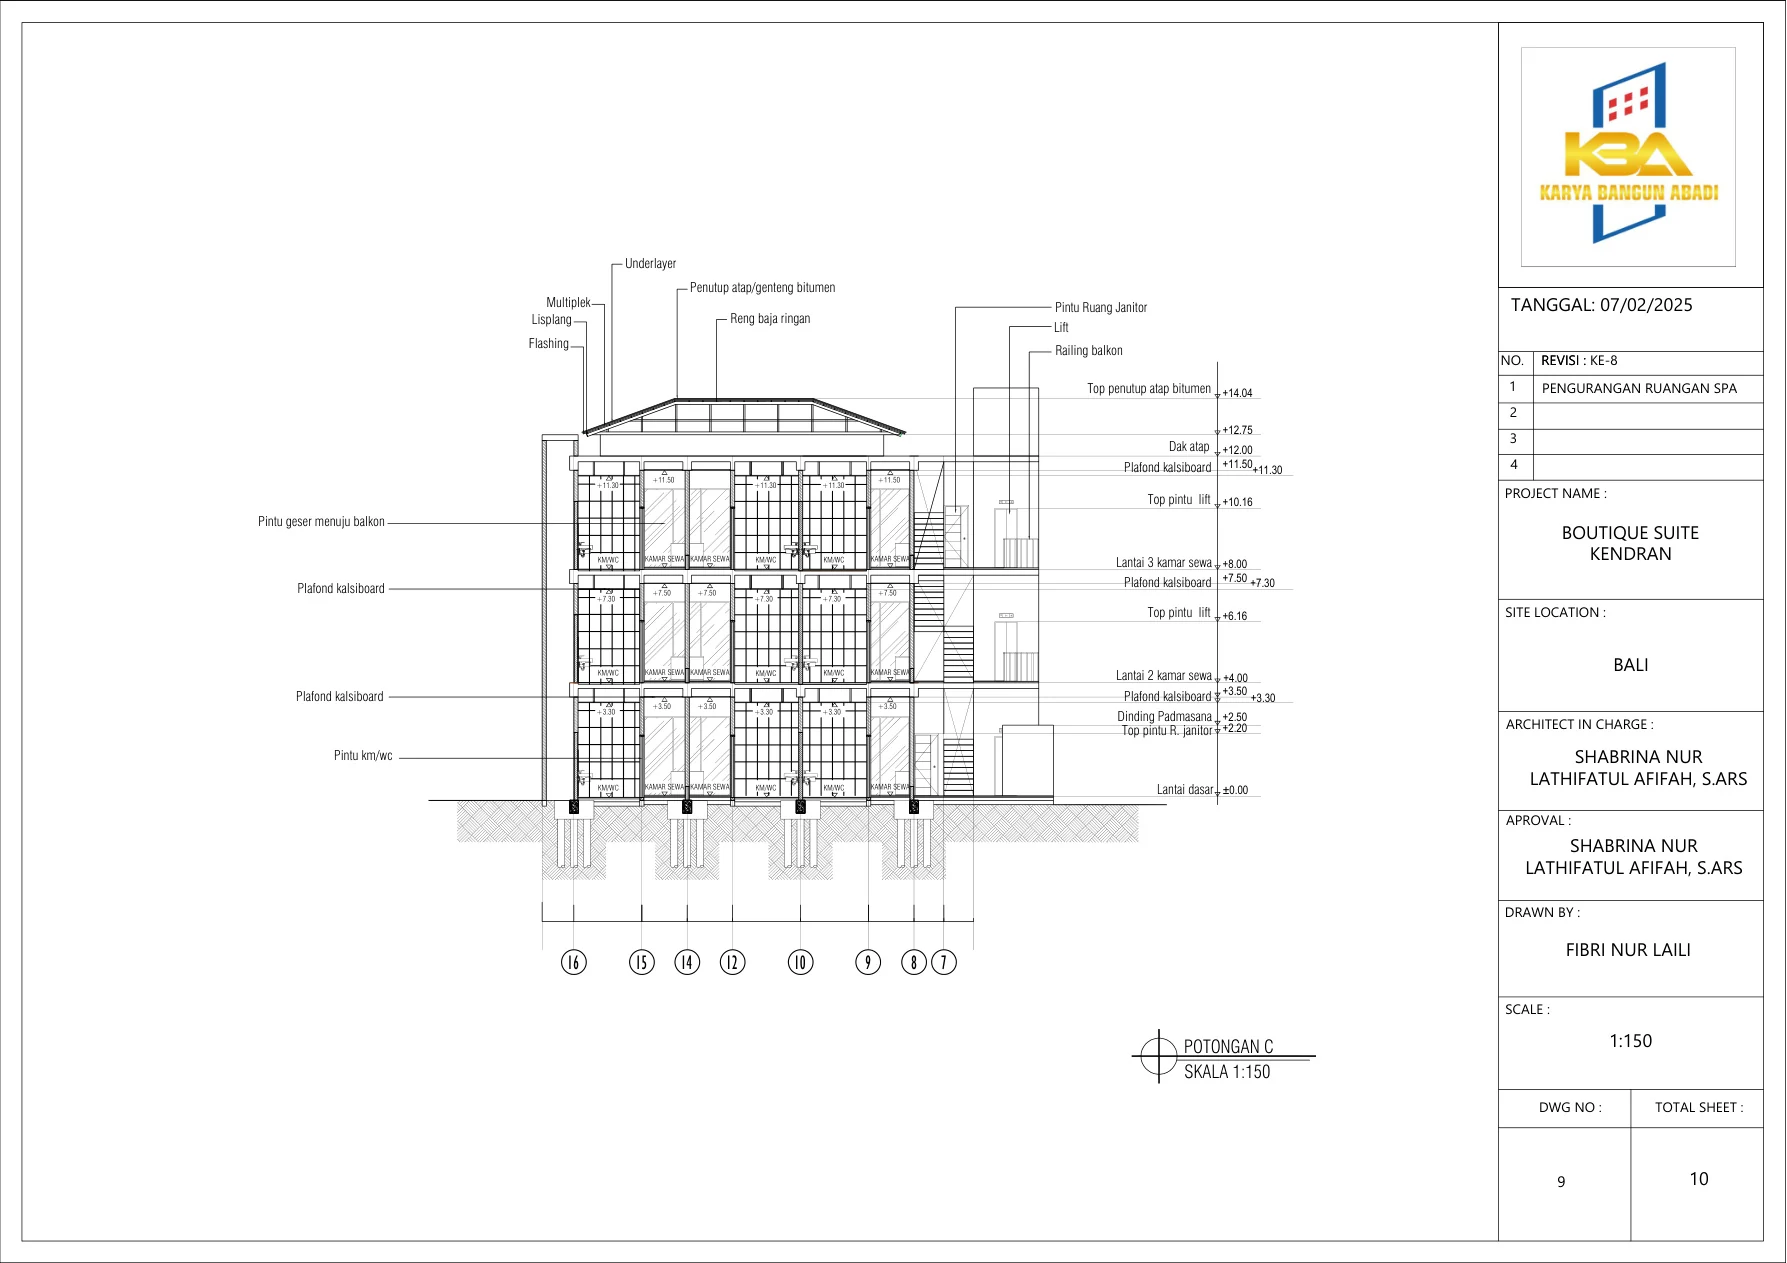
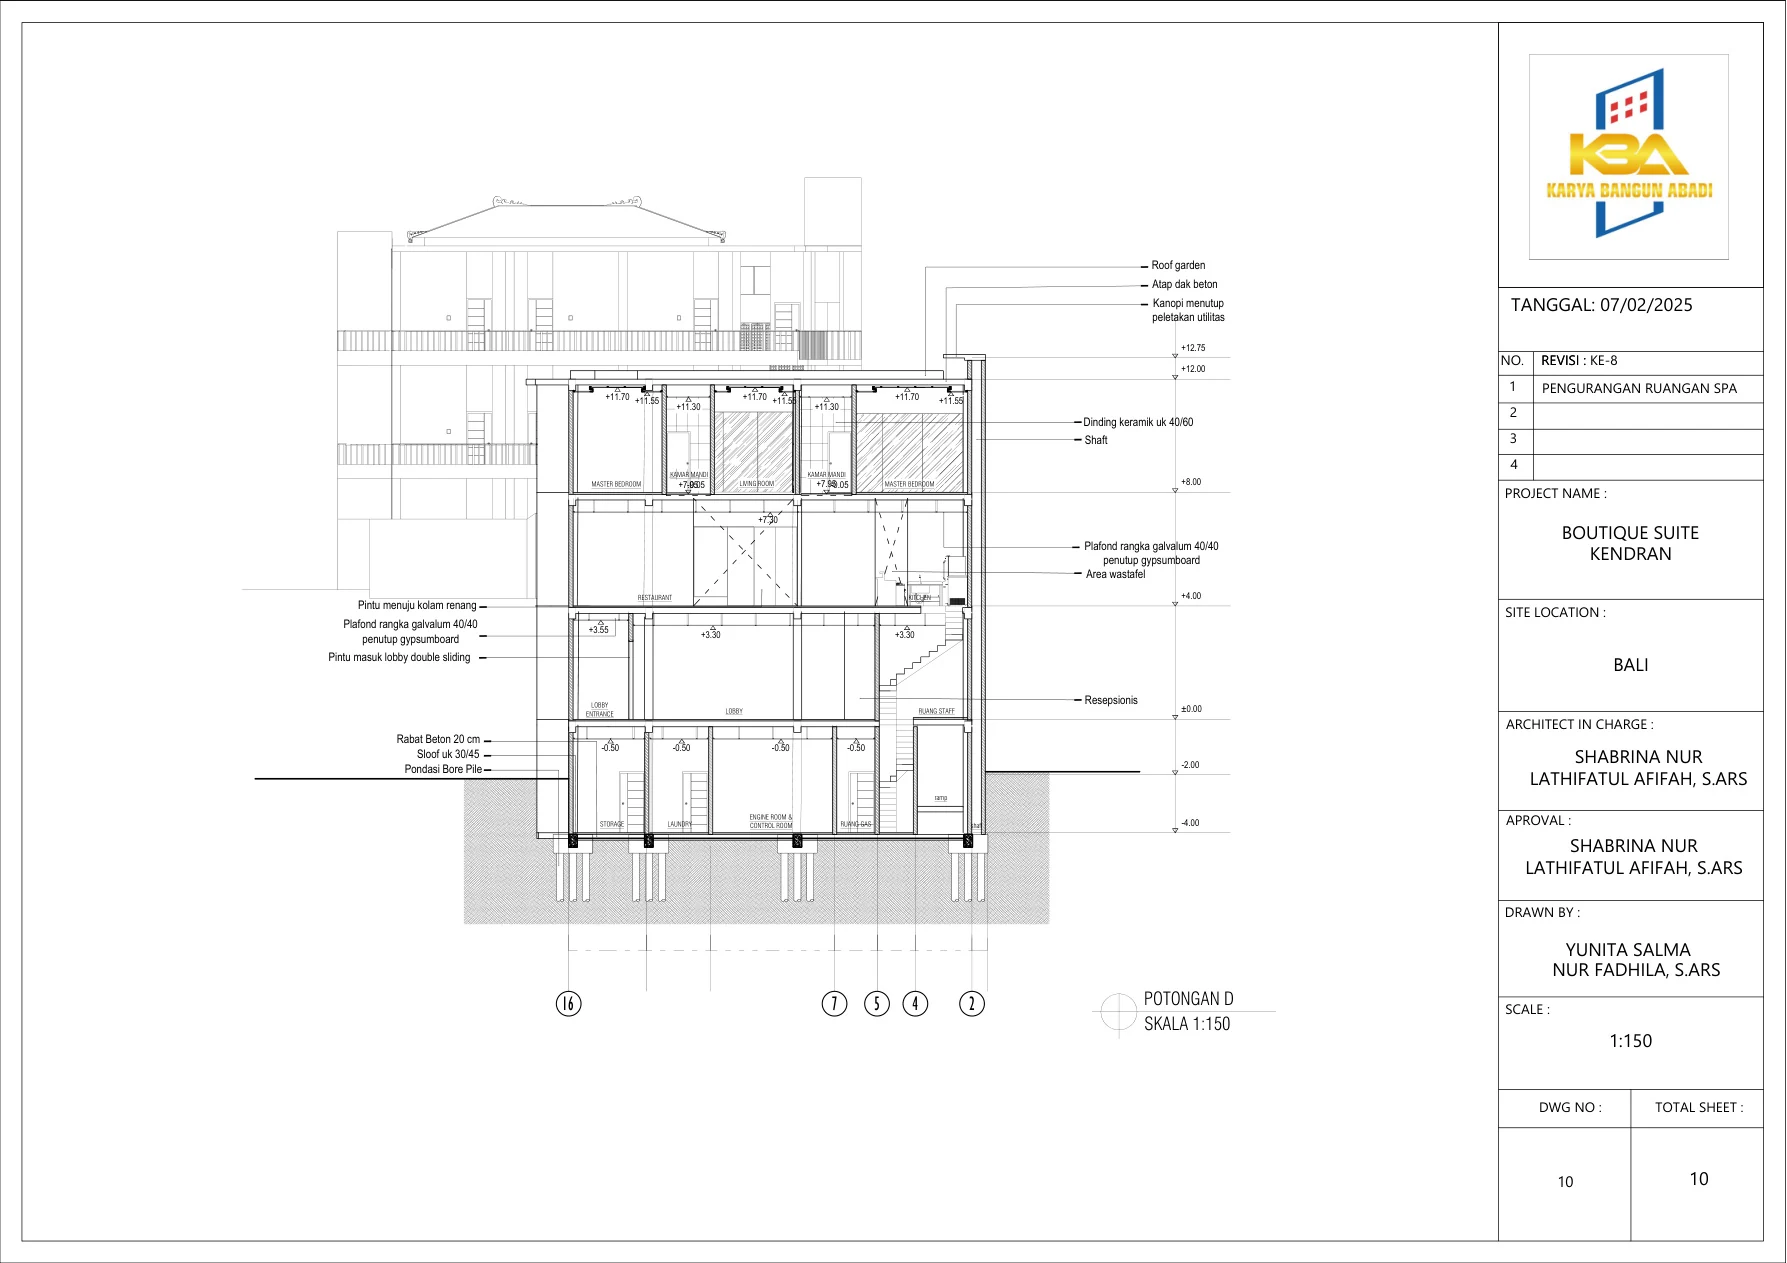
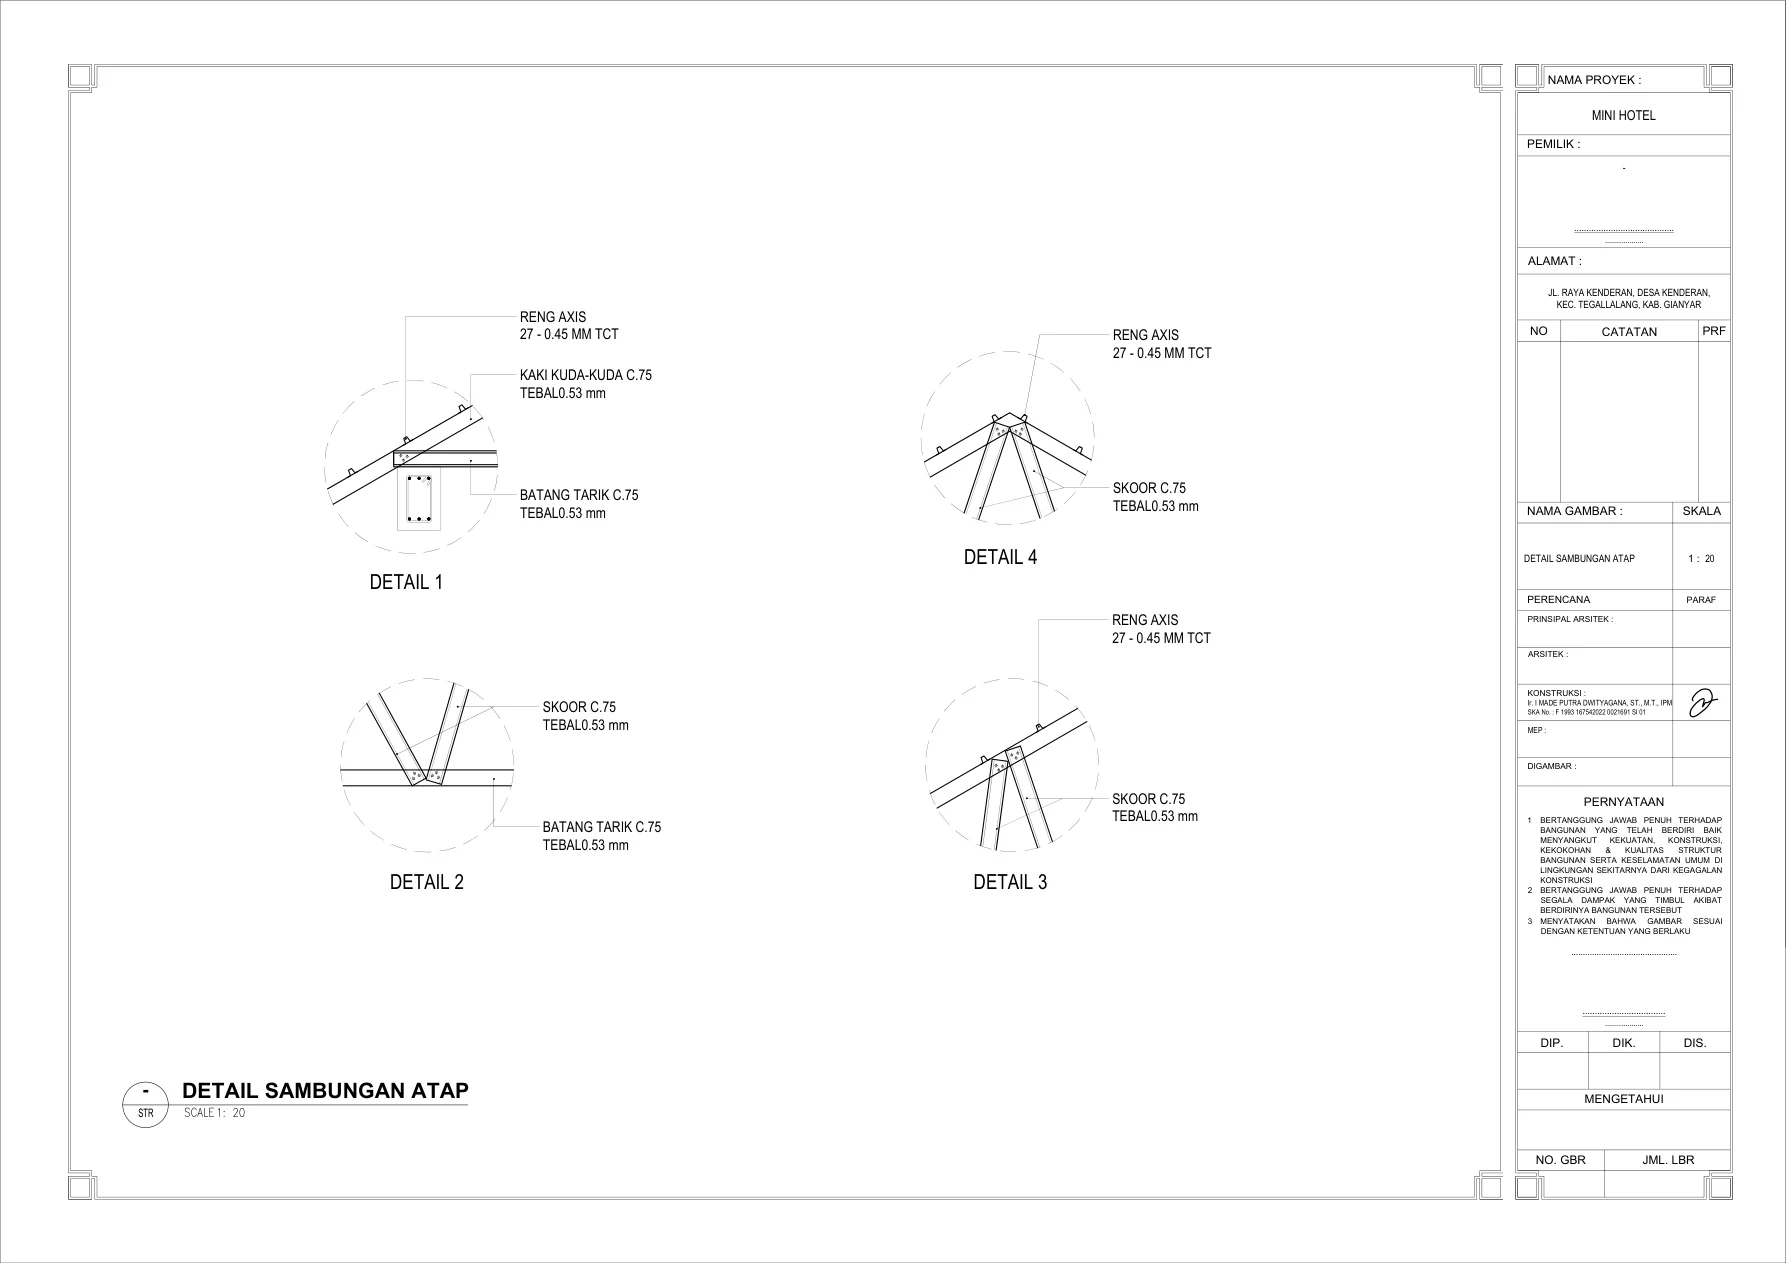
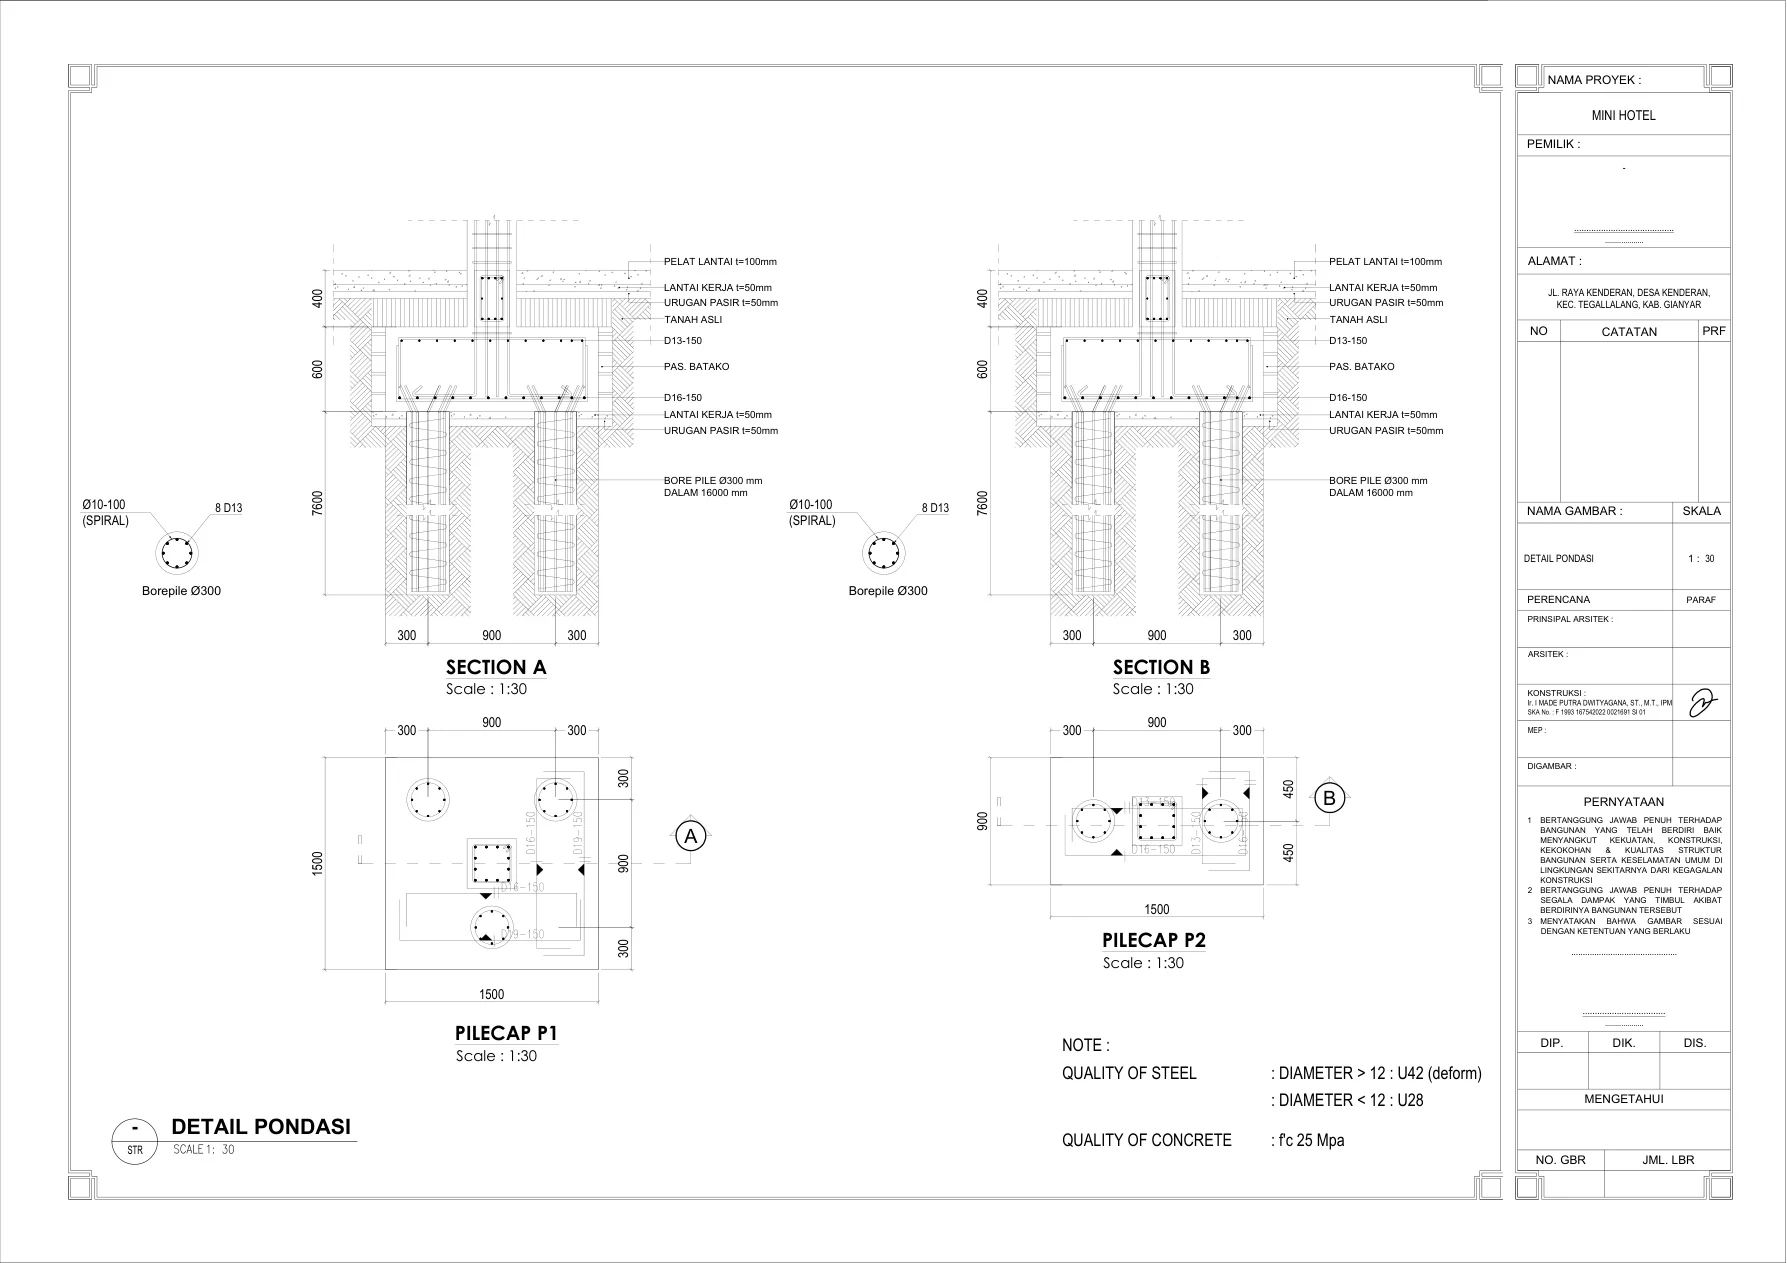
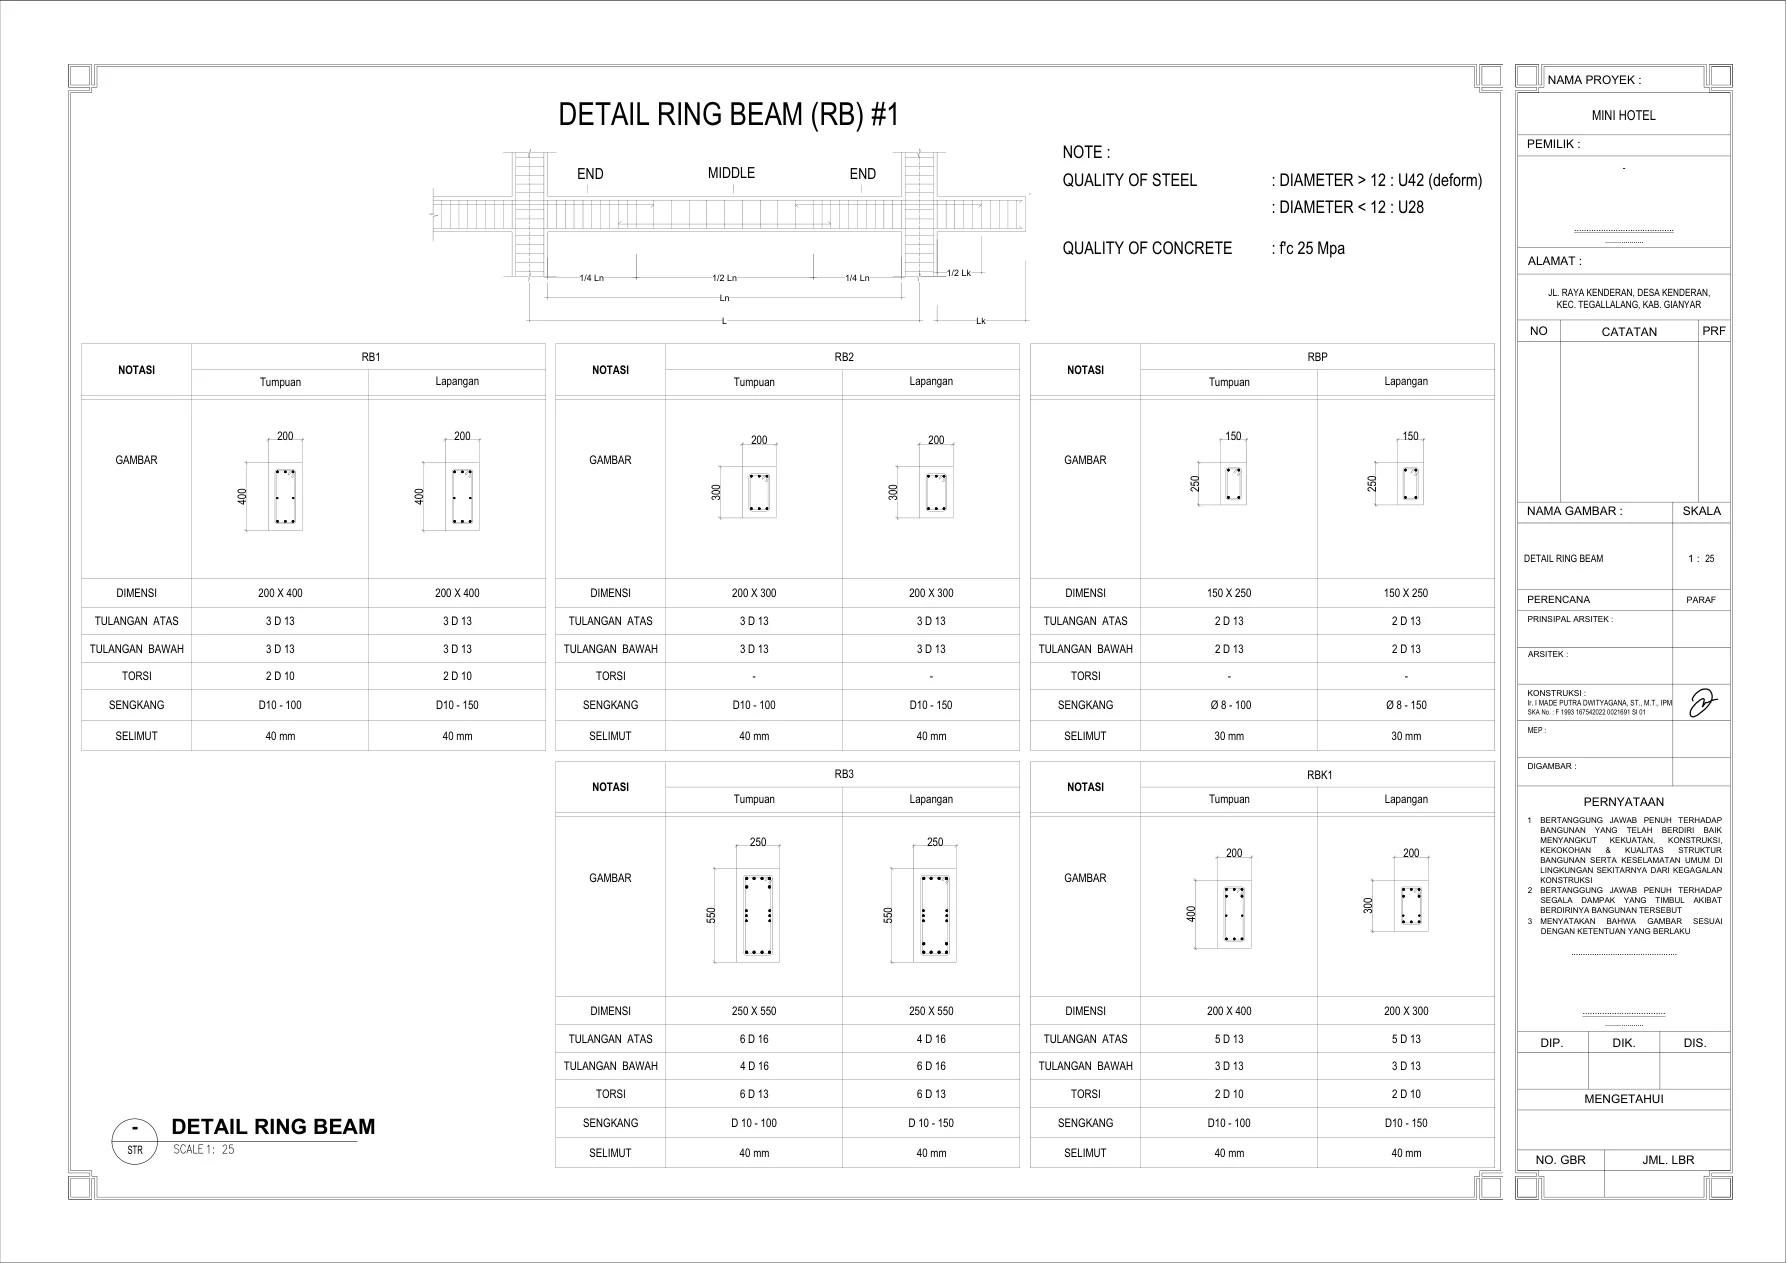
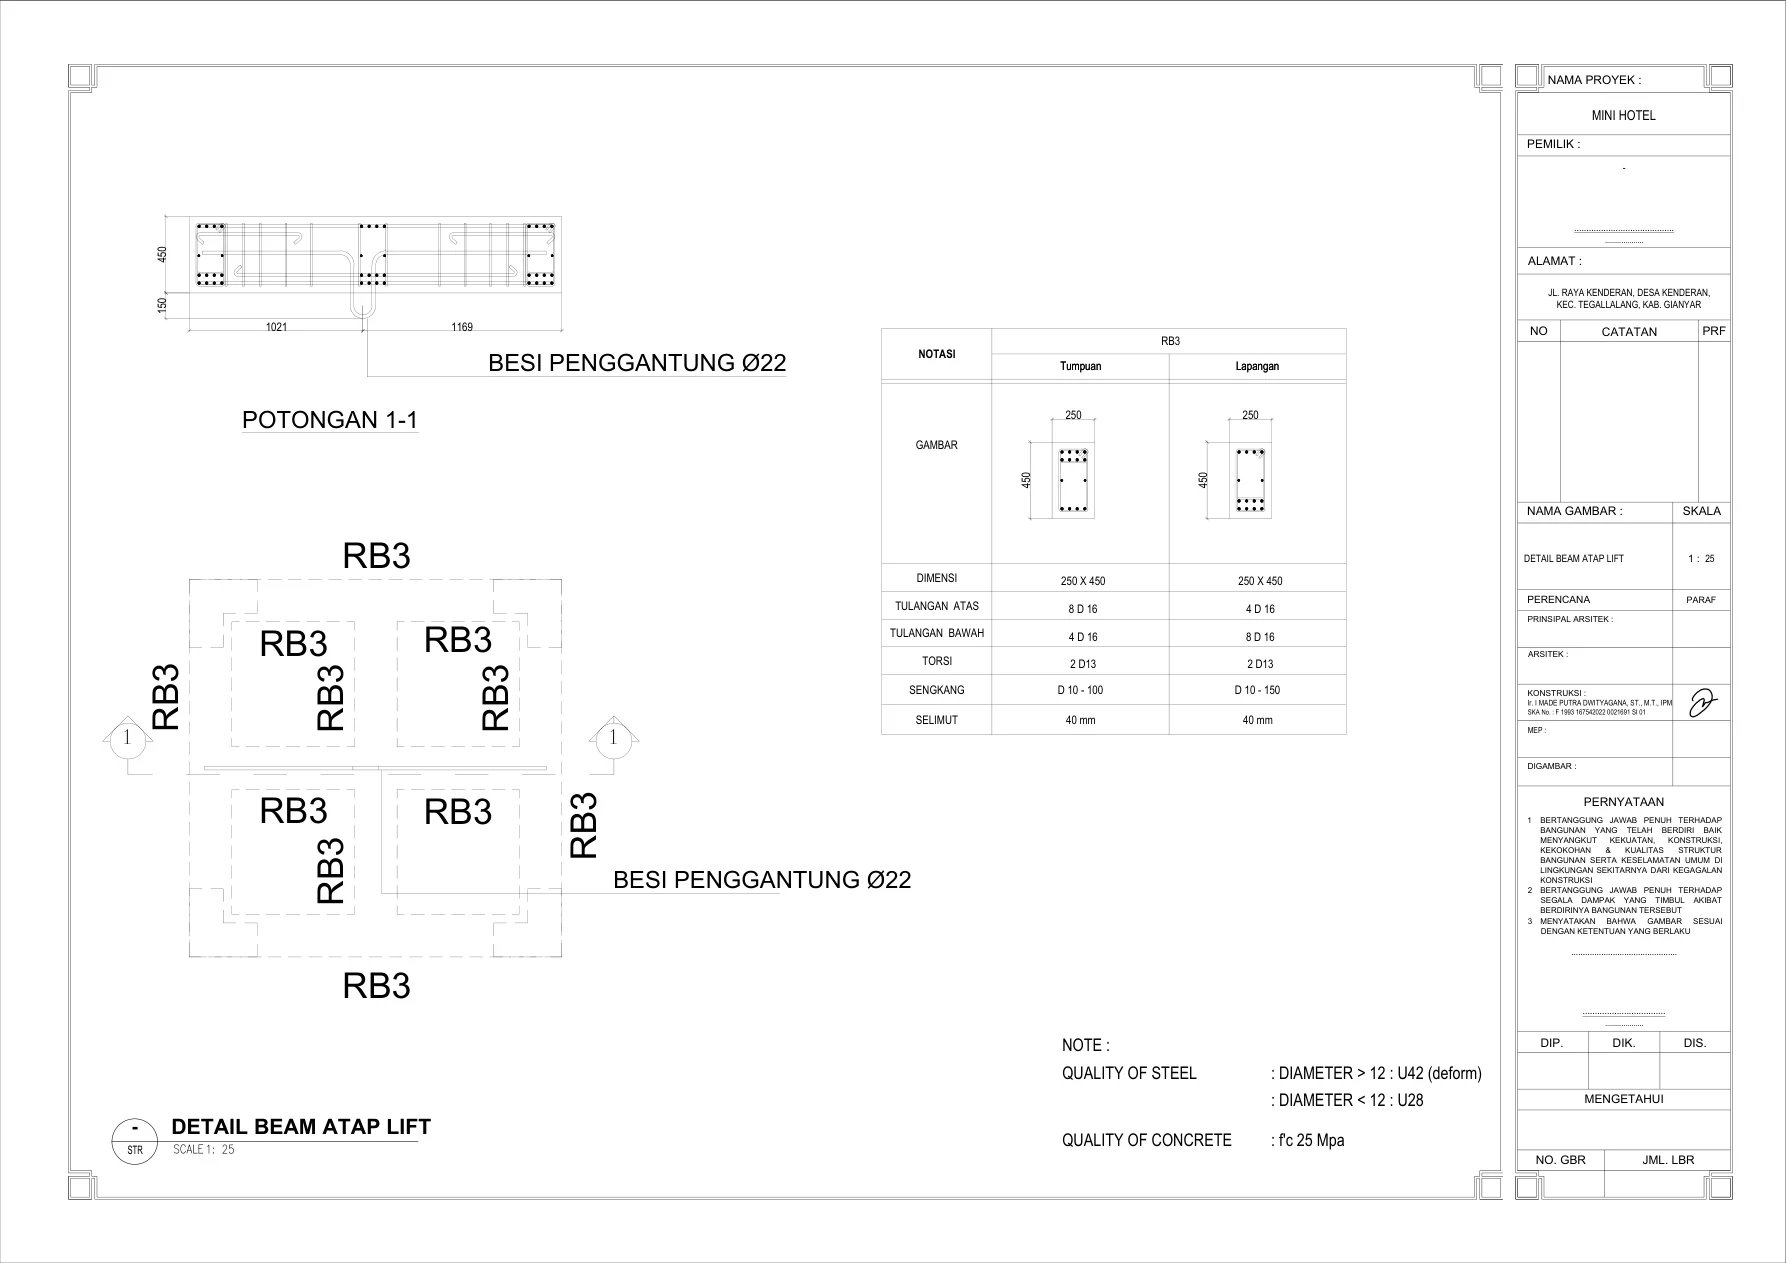
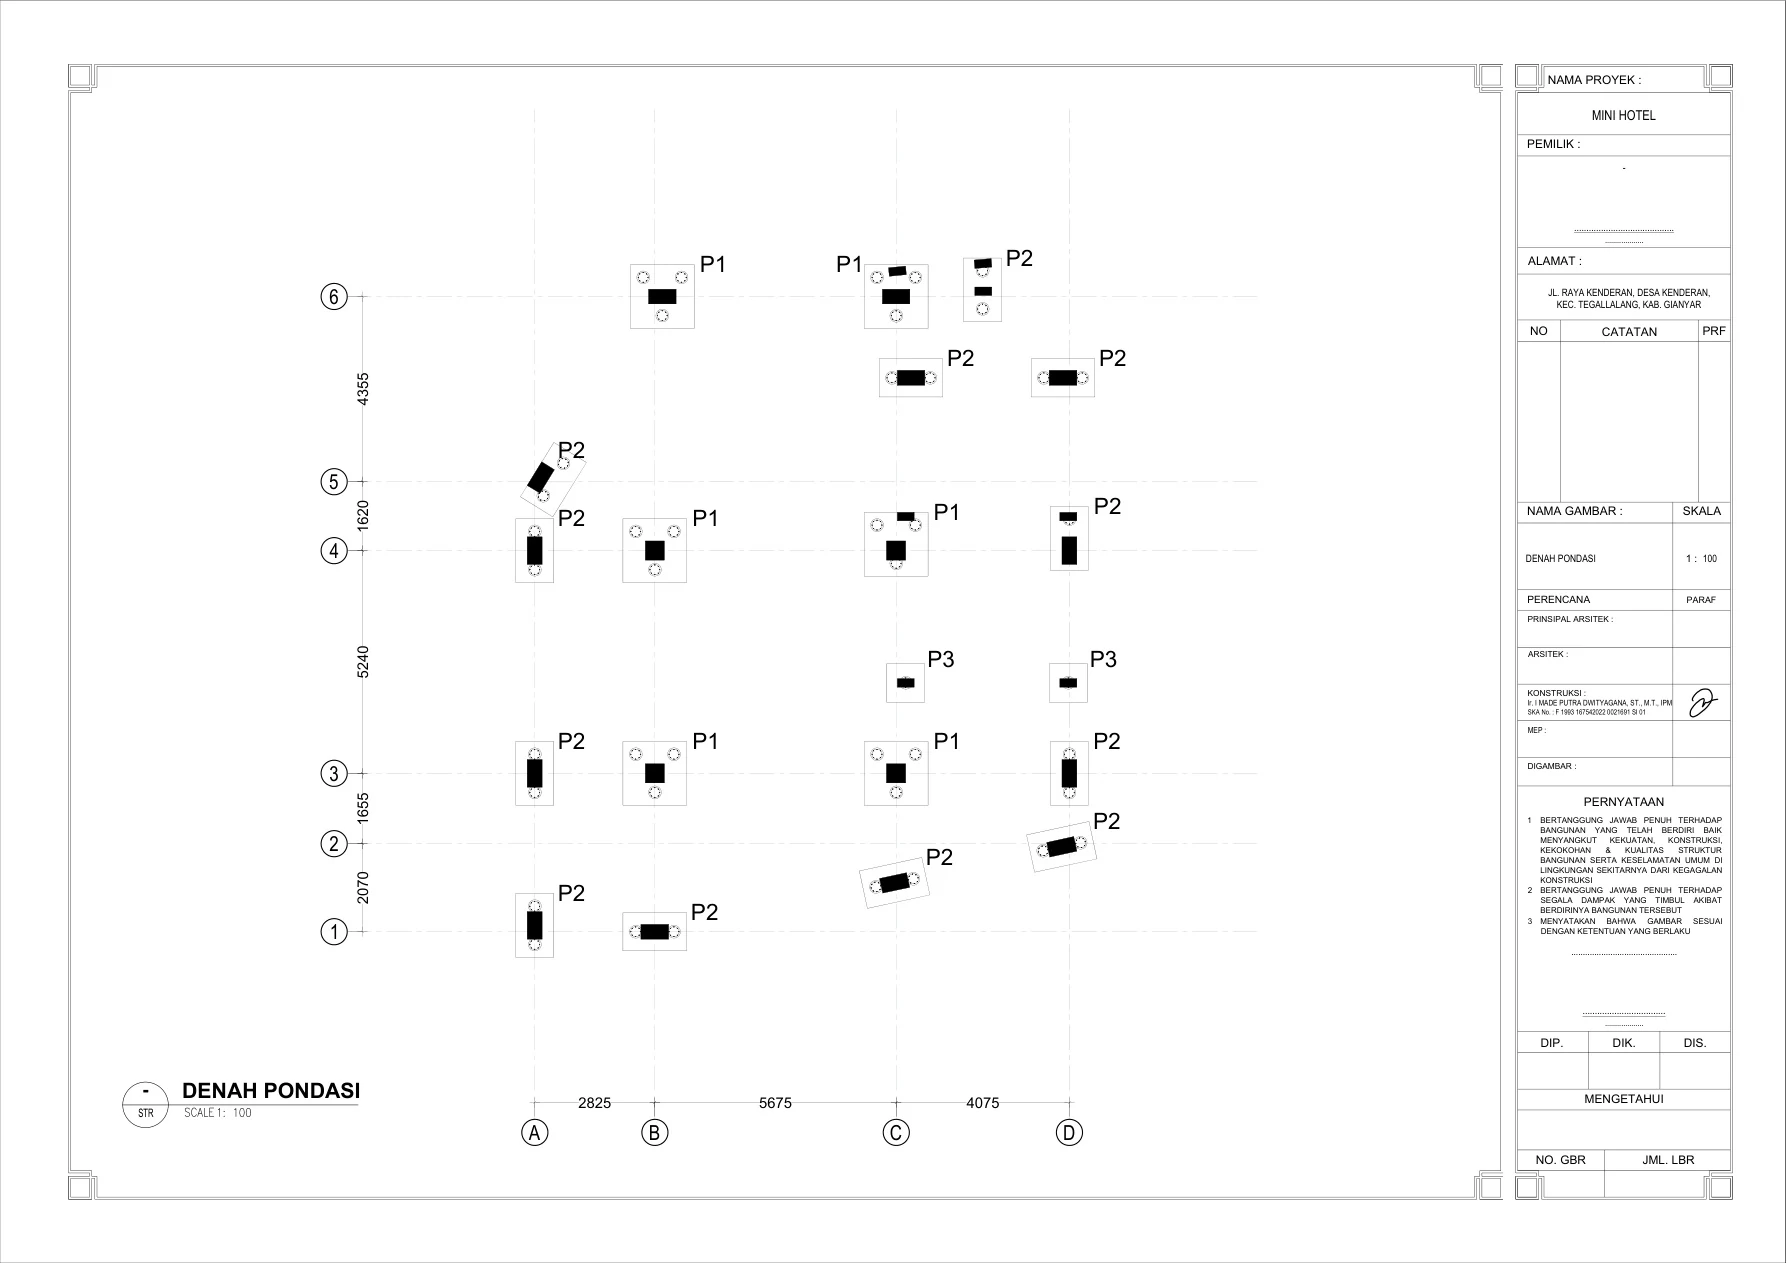
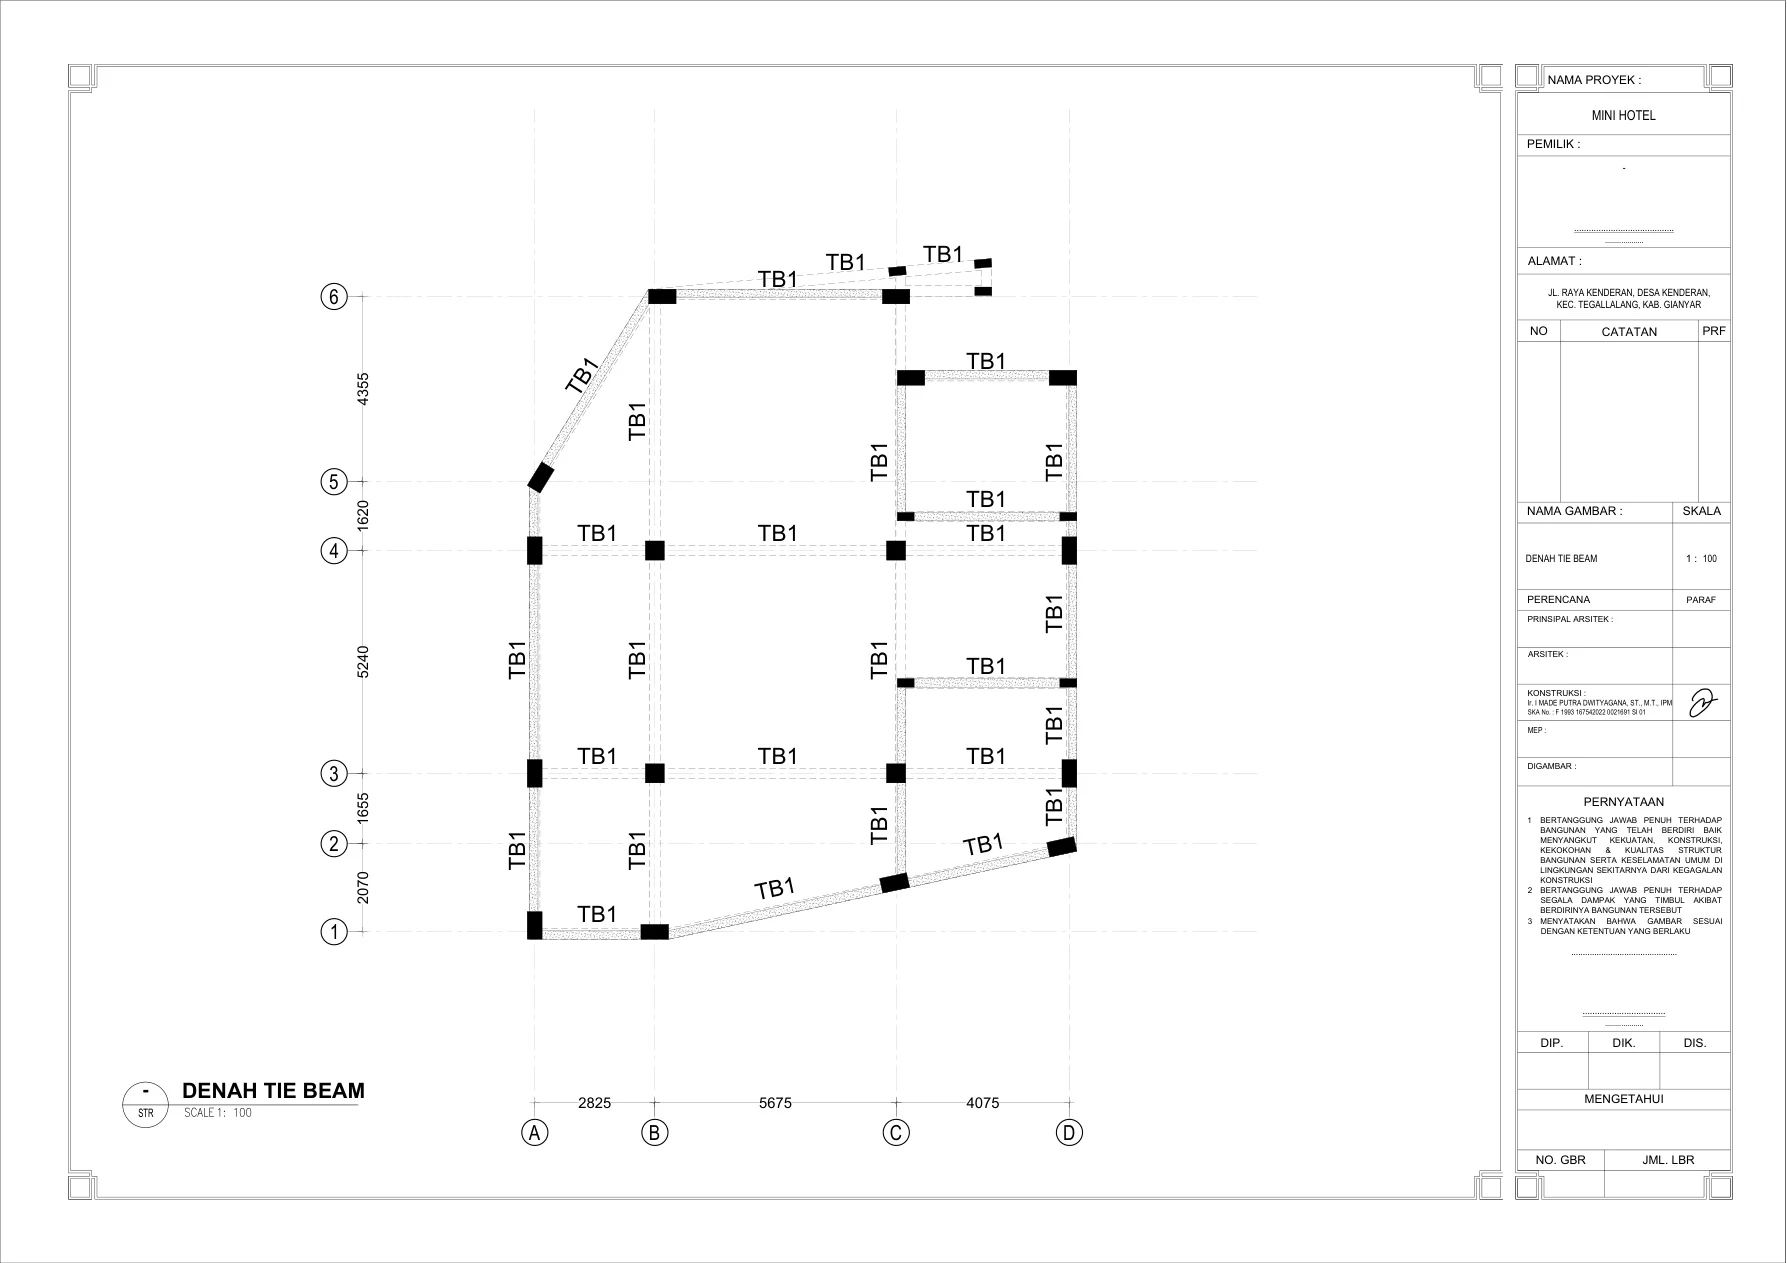
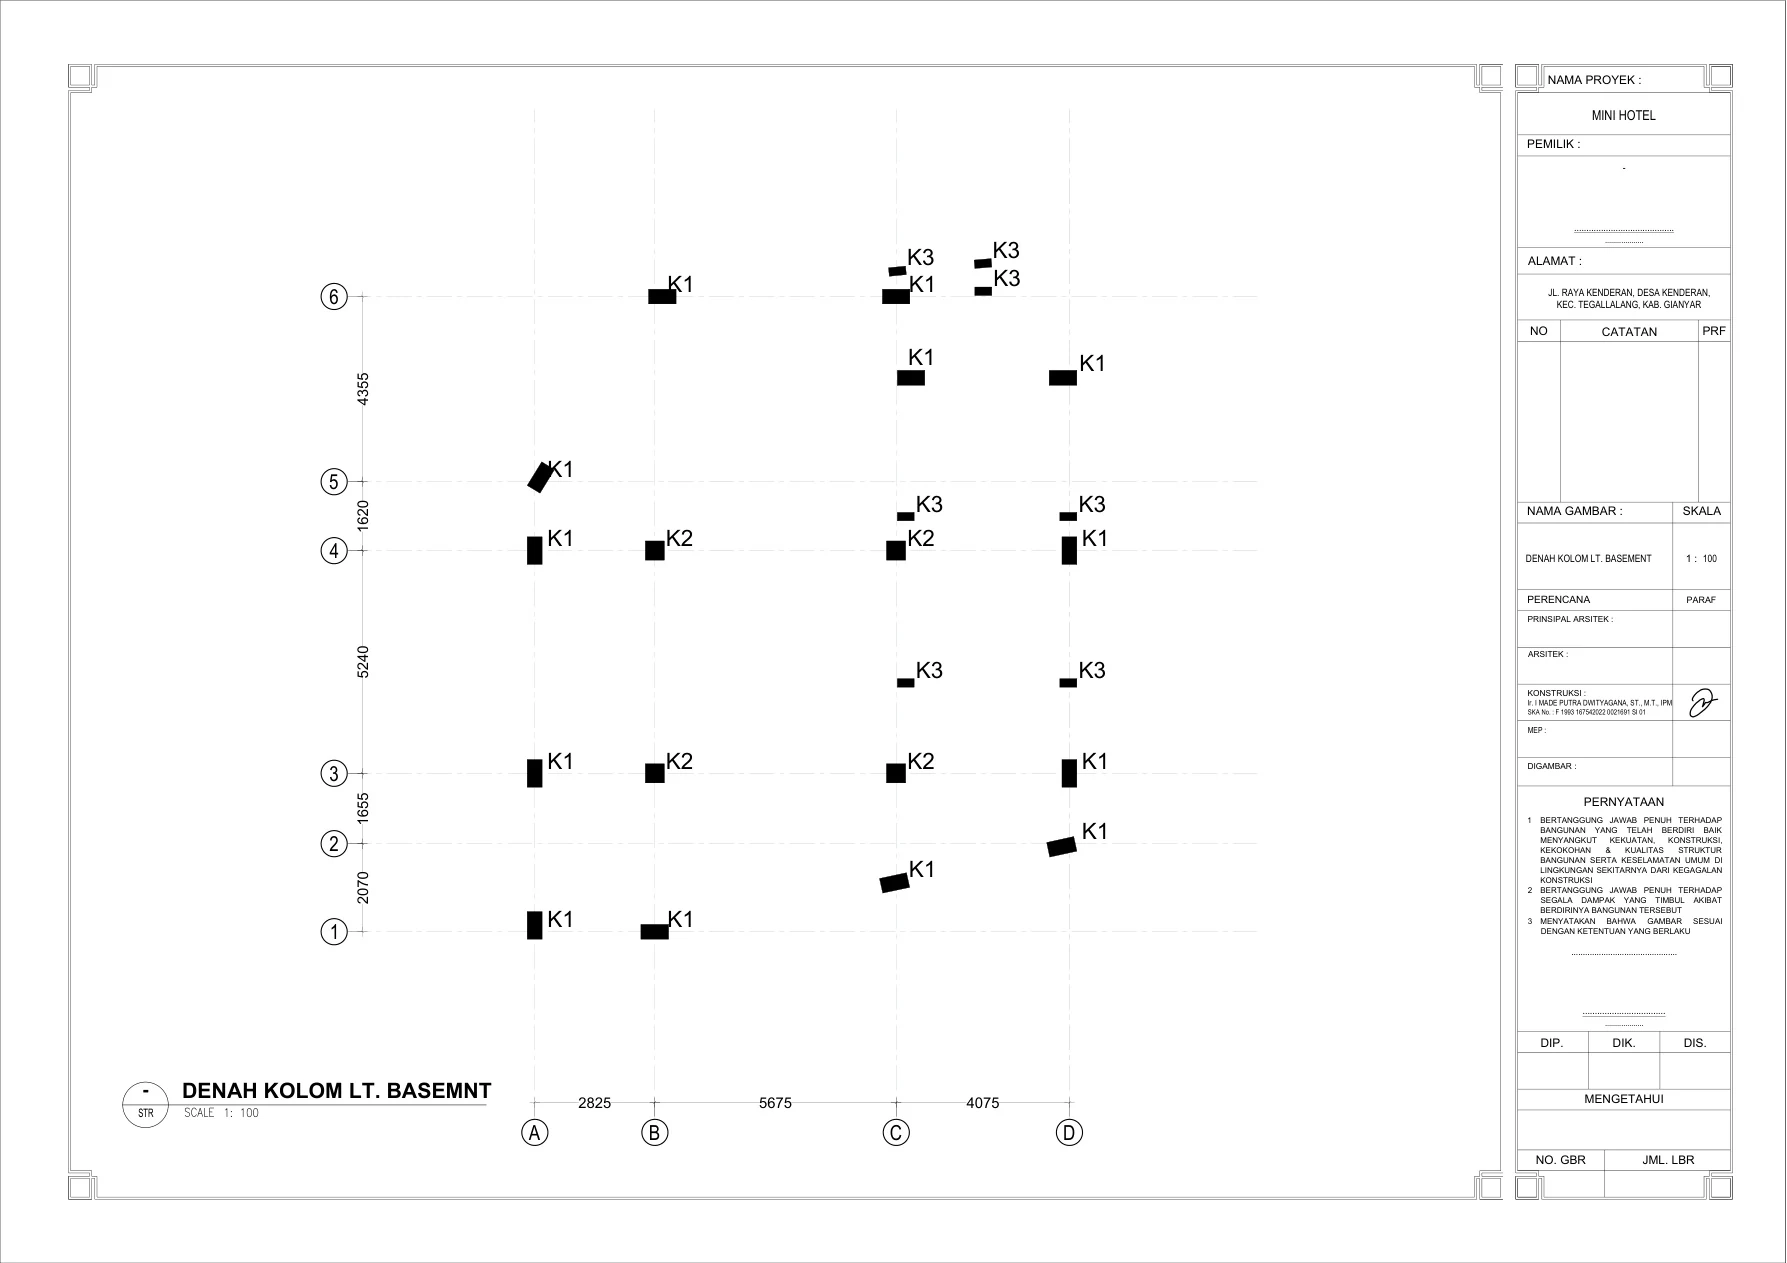
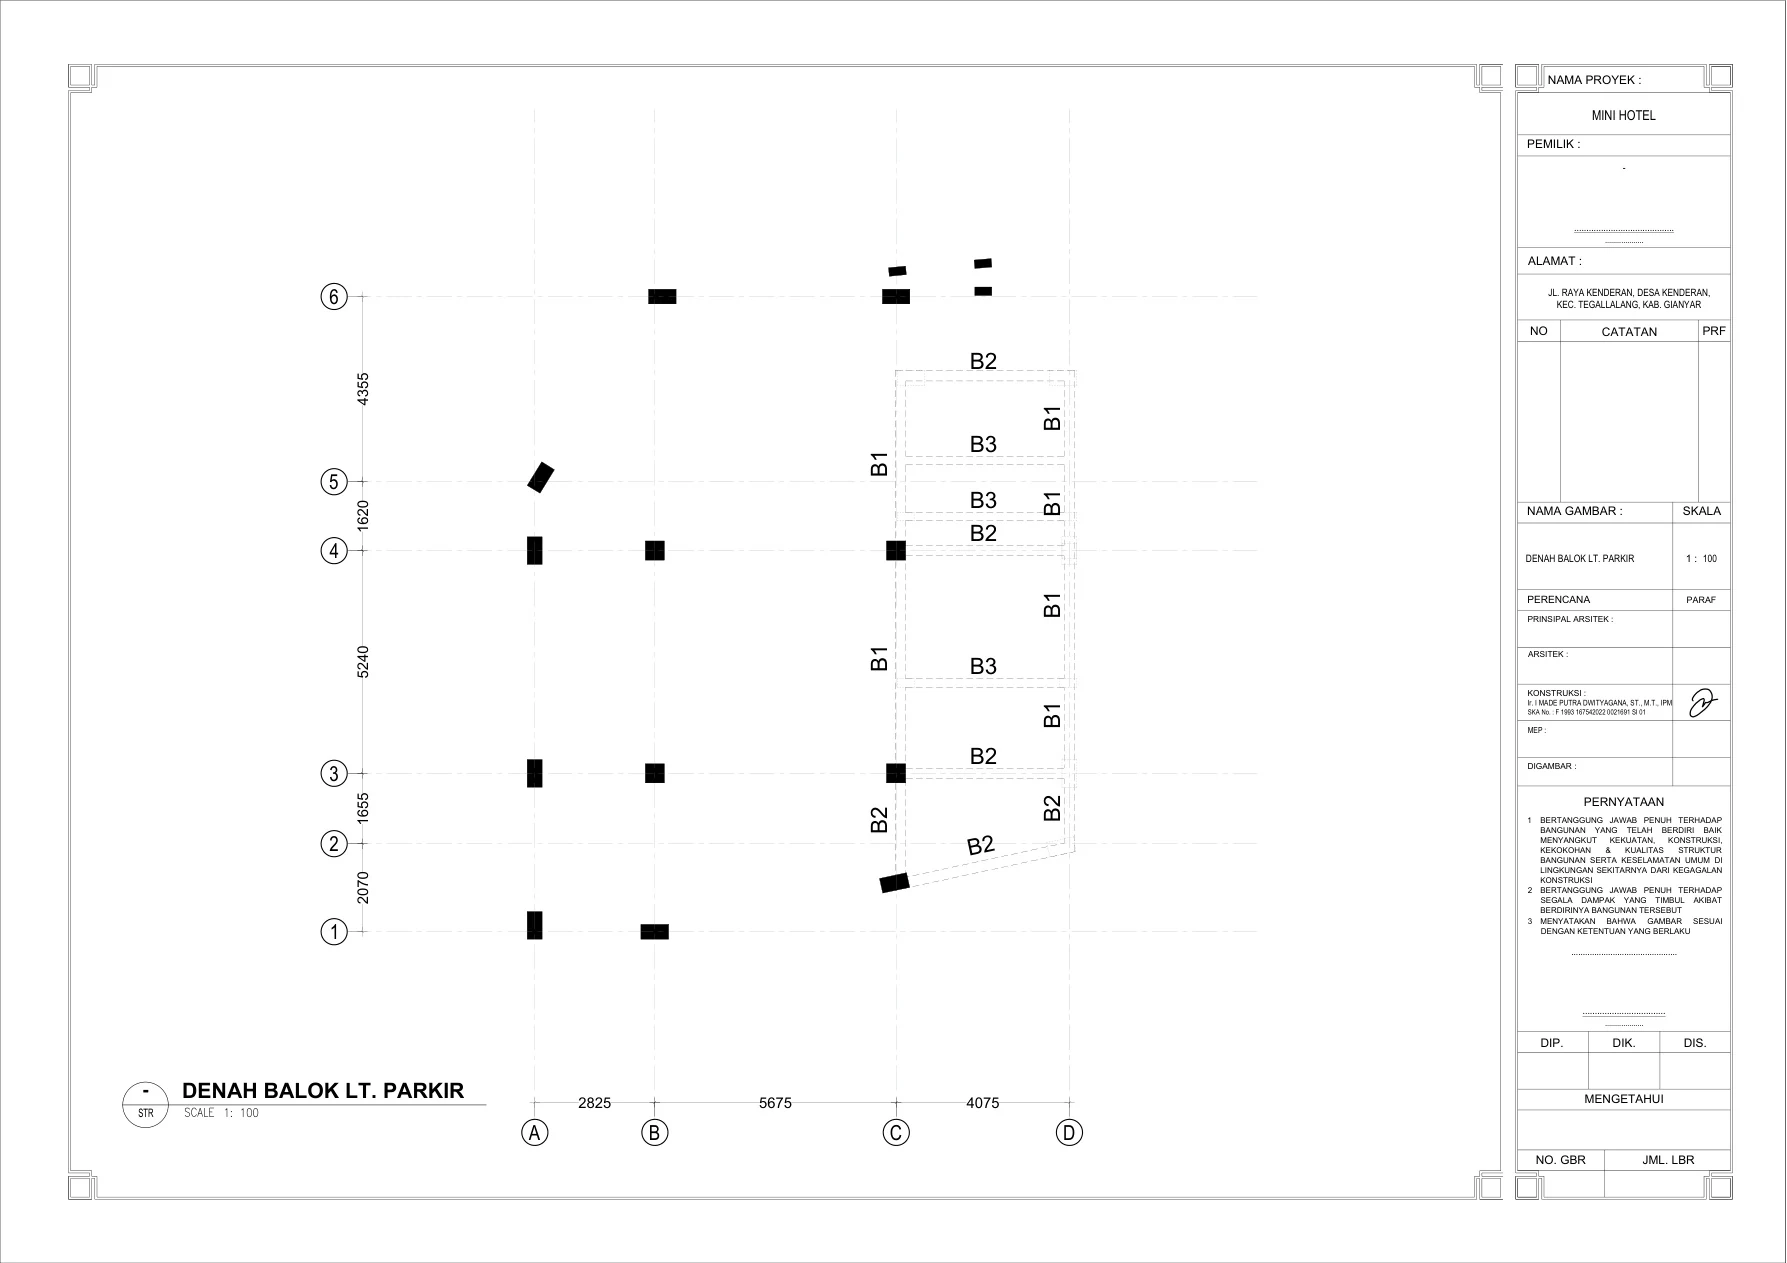
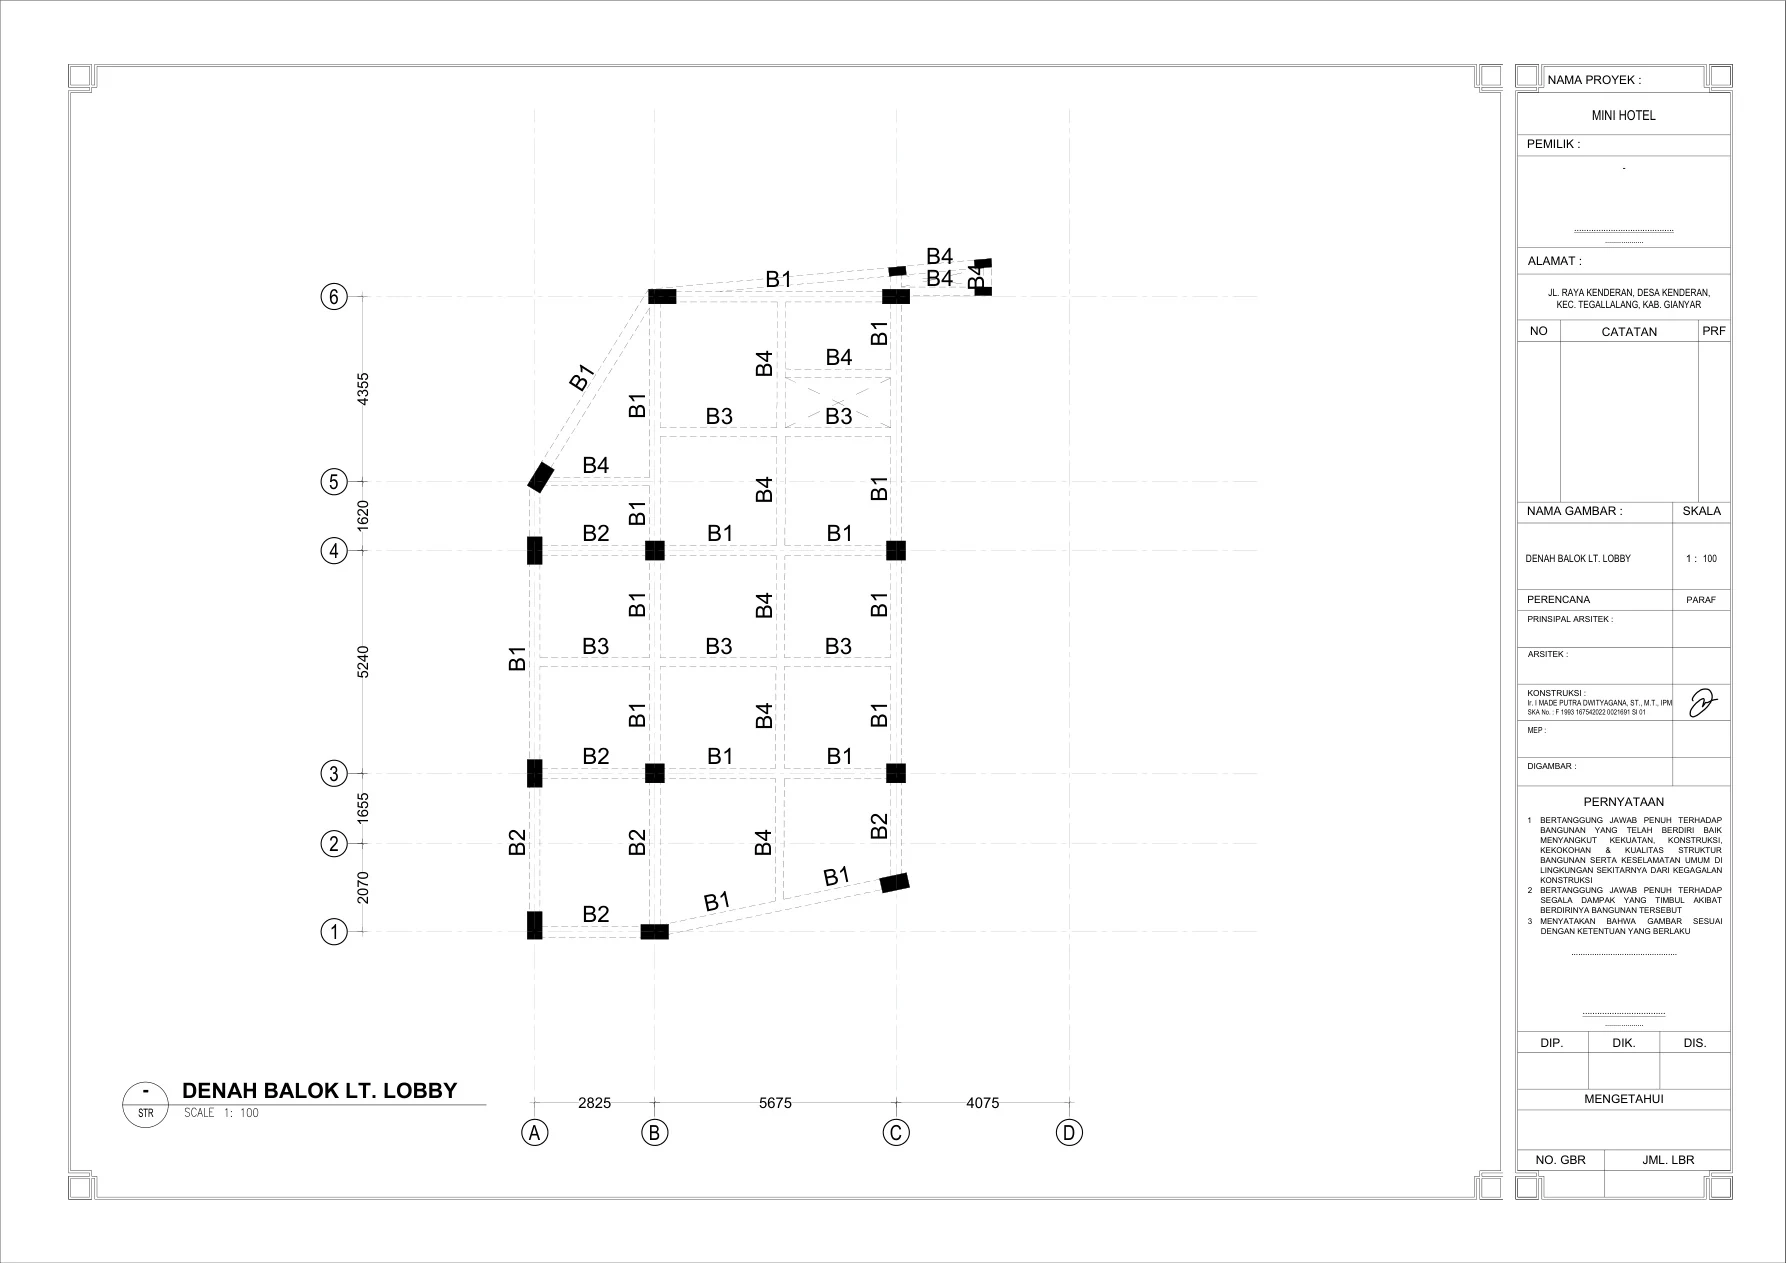
Architectural & Structural Planning Documents
The following documents represent the full architectural and structural planning drawings for Tevah Suite Ubud. They cover floor plans, facades, and cross-sections, followed by structural engineering drawings including foundations, framing, and reinforcement details.
About This Opportunity
Tevah Suite Ubud is developed by PT Jam Asia Property under the Triproom.id platform, specializing in property development and investment structuring, hospitality management and distribution, and strategic partnerships for asset growth. The project represents Triproom.id's commitment to building credible, investor-ready hospitality assets in Bali's most resilient luxury markets.
For qualified investors seeking to discuss this joint venture opportunity, access the full investment deck, or explore participation structures, please reach out through the Triproom.id investor relations channel.