

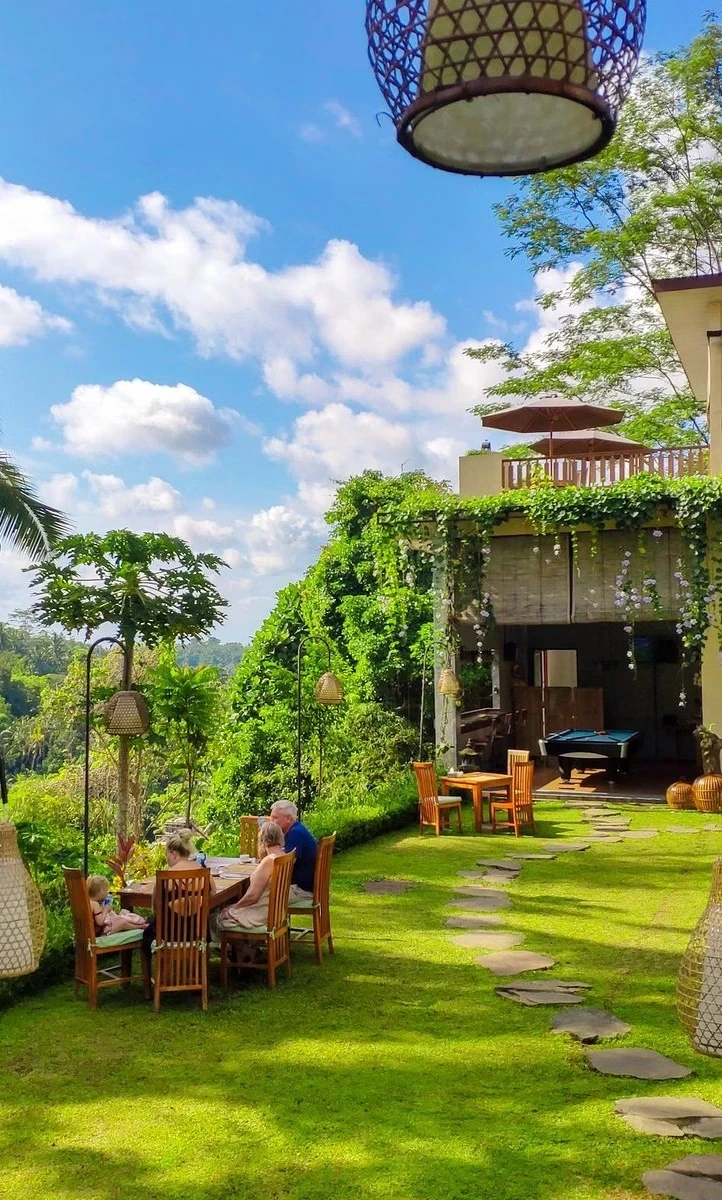
Mahameru Uluwatu is a fully operational boutique hotel in the Labuan Sait corridor of Uluwatu, Bali—one of Southeast Asia's fastest-growing luxury hospitality micro-markets. This 2026–2035 investor memorandum presents the property as an established operating asset with embedded growth potential and long-term capital appreciation exposure.
Labuan Sait · Uluwatu · Bali. Confidential investor presentation for the 2026–2035 investment horizon.
Executive Summary
Investment Opportunity at a Glance
The investment thesis is anchored in three pillars: a prime, supply-constrained location within Labuan Sait; an established operational platform with existing guest reviews, brand recognition, and revenue-generating facilities; and long-term capital appreciation potential driven by land scarcity, luxury tourism growth, and Uluwatu's evolution as a globally recognised hospitality destination.
Location Intelligence
Strategic Location Map — Mahameru Uluwatu
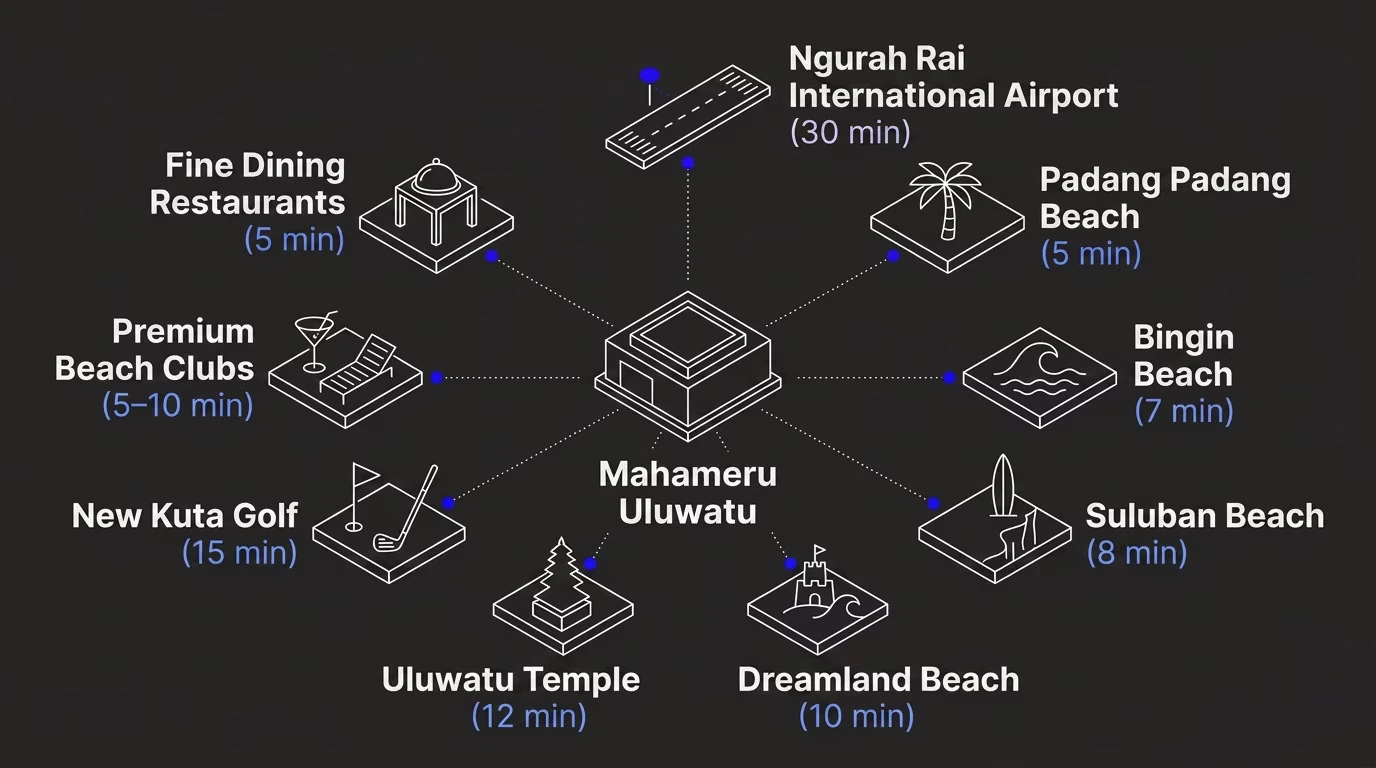
Mahameru Uluwatu occupies a central position within the Labuan Sait lifestyle ecosystem. Proximity to internationally recognised beaches, beach clubs, restaurants, and cultural attractions lets guests experience the full spectrum of Uluwatu while retaining the privacy of a boutique hotel. This centrality is a structural competitive advantage that cannot be replicated through renovation or repositioning.
Asset Profile
Property Overview — Mahameru Uluwatu
The fully operational property combines intimate scale with comprehensive facilities, creating an environment suited to premium leisure travellers seeking personalised service and authentic Balinese atmosphere.
| Asset | Overview |
|---|---|
| 12 Guest Rooms | Thoughtfully designed rooms delivering a consistent boutique experience aligned with international luxury standards and personalised service expectations. |
| Infinity Swimming Pool | A signature guest amenity and visual centrepiece for marketing, social content, and premium brand positioning. |
| Restaurant & Dining | An on-site restaurant complementing the boutique positioning and contributing to ancillary revenue. |
| Spa & Wellness | Dedicated facilities serving demand for health-focused travel and per-guest revenue enhancement. |
| Parking & Guest Services | On-site parking, airport transfers, laundry, tours, and concierge services complete the full-service offering. |
Architectural & Lifestyle Gallery
| Area | Investment Relevance |
|---|---|
| Architecture & Grounds | Natural stone, tropical timber, and lush landscaping establish an authentic sense of place. |
| Signature Pool | A key visual asset for premium digital marketing and direct-booking campaigns. |
| Guest Rooms | Intimate, well-appointed rooms designed for the international boutique luxury traveller. |
| Restaurant & Dining | An open-air environment extending the guest experience and creating ancillary revenue opportunities. |
Market Positioning
Current Guest Profile
Mahameru Uluwatu is positioned in the boutique luxury segment. Unlike volume-driven accommodation, its competitive advantage rests on personalised service, intimate scale, and proximity to Uluwatu's strongest lifestyle attractions.
| Guest Segment | Demand Profile |
|---|---|
| International Leisure Travellers | Visitors from Australia, Europe, and North America seeking curated boutique experiences, with willingness to pay premium rates for quality and location. |
| Couples & Honeymooners | A high-value Bali segment with longer average stays, greater ancillary spending, and stronger brand loyalty. |
| Wellness Travellers | Guests prioritising spa, yoga, meditation, and health-focused experiences aligned with Uluwatu and Mahameru's amenities. |
| Digital Nomads & Remote Professionals | High-income remote workers seeking extended stays, supporting mid-week occupancy and longer booking windows. |
Competitive Intelligence
Why Mahameru Stands Apart
With boutique hotel supply relatively constrained against growing international demand, Mahameru benefits from structural and operational advantages that are difficult to replicate through new development or repositioning.
| Competitive Advantage | Detail |
|---|---|
| Prime Location Permanence | The established Labuan Sait position cannot be replicated; future competitors must operate from a less embedded location. |
| Boutique Scale Premium | A 12-key inventory supports a degree of personalisation that can outperform larger resorts on guest review platforms. |
| Existing Cash Flow & Operations | Revenue is generated from day one, without construction risk, a pre-opening period, or the need to build an operating team from scratch. |
| Brand Recognition & Reviews | Existing online presence, OTA listings, and guest-review history form an intangible asset that would take years to recreate. |
| Untapped Revenue Upside | Dynamic pricing, direct-booking optimisation, revenue management, and ancillary expansion offer identifiable value-creation levers. |
Revenue Architecture
Diversified Income Streams
Mahameru's facilities support meaningful income beyond rooms, reducing dependence on occupancy alone and enhancing total revenue per available key (TRevPAR). Effective revenue management can develop each stream further.
| Revenue Stream | Role |
|---|---|
| Room Revenue | Core income driven by ADR management, occupancy optimisation, and channel mix. |
| Restaurant & Dining | In-house and external dining with material ancillary revenue and margin potential. |
| Spa & Wellness | Treatments, packages, and programming for guests and the local wellness market. |
| Airport Transfers | High-margin transport that adds convenience and per-stay revenue. |
| Private & Romantic Dining | Premium experiences for honeymoon and anniversary guests. |
| Tours & Experiences | Curated activities and cultural tours generating commissions while improving guest satisfaction. |
Financial Model — Base-Case Assumptions
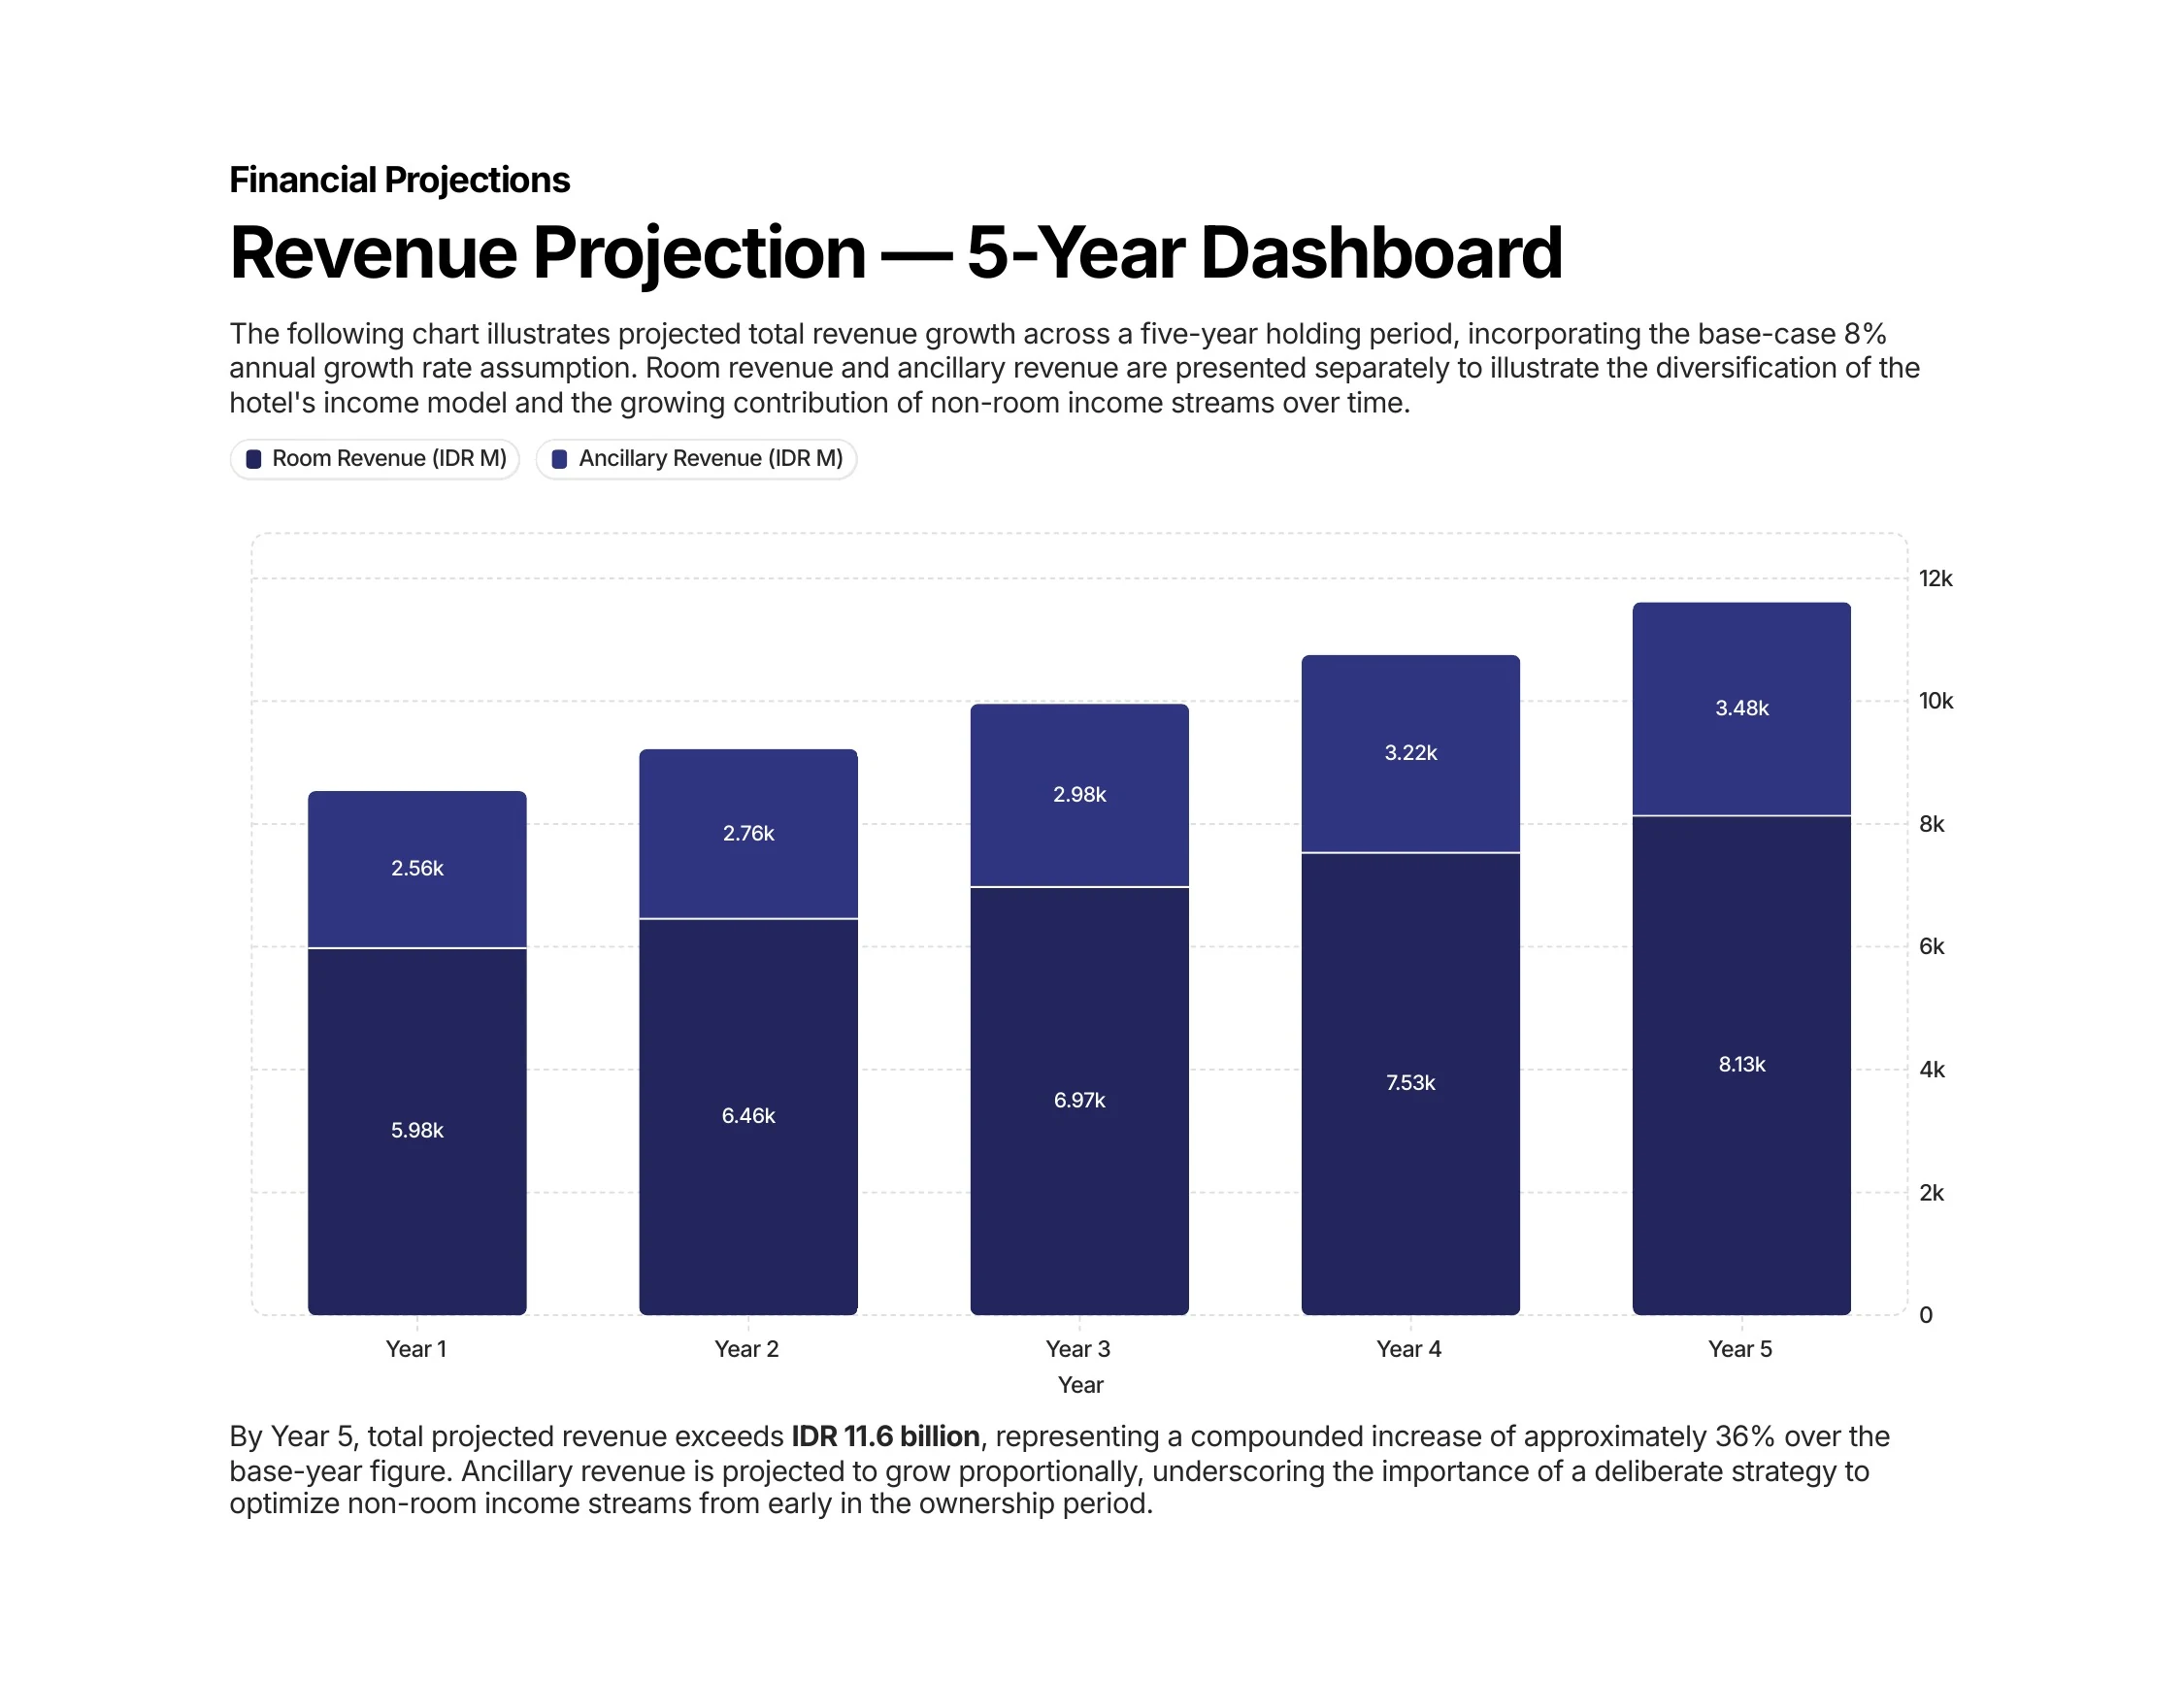
The model uses conservative operating assumptions aligned with boutique hotel benchmarks in Uluwatu. It reflects a stabilised base case and should be read as indicative management estimates, not audited financial statements. Actual results depend on management, market conditions, competition, and broader economic factors.
Five-Year Revenue Projection
| Year | Room Revenue | Ancillary Revenue | Total Revenue |
|---|---|---|---|
| Year 1 | IDR 5.98B | IDR 2.56B | IDR 8.54B |
| Year 2 | IDR 6.46B | IDR 2.76B | IDR 9.22B |
| Year 3 | IDR 6.97B | IDR 2.98B | IDR 9.95B |
| Year 4 | IDR 7.53B | IDR 3.22B | IDR 10.75B |
| Year 5 | IDR 8.13B | IDR 3.48B | IDR 11.61B |
By Year 5, projected total revenue exceeds IDR 11.6 billion—approximately 36% above the base year. Ancillary income grows proportionally, reinforcing the importance of optimising non-room revenue from the start of the holding period.
Operating Expense Breakdown
| Cost Category | Share |
|---|---|
| Payroll & Benefits | 38% |
| OTA Commissions | 15% |
| Utilities | 12% |
| Maintenance & Repairs | 10% |
| Food & Beverage COGS | 10% |
| Marketing & Digital | 9% |
| Admin & General | 6% |
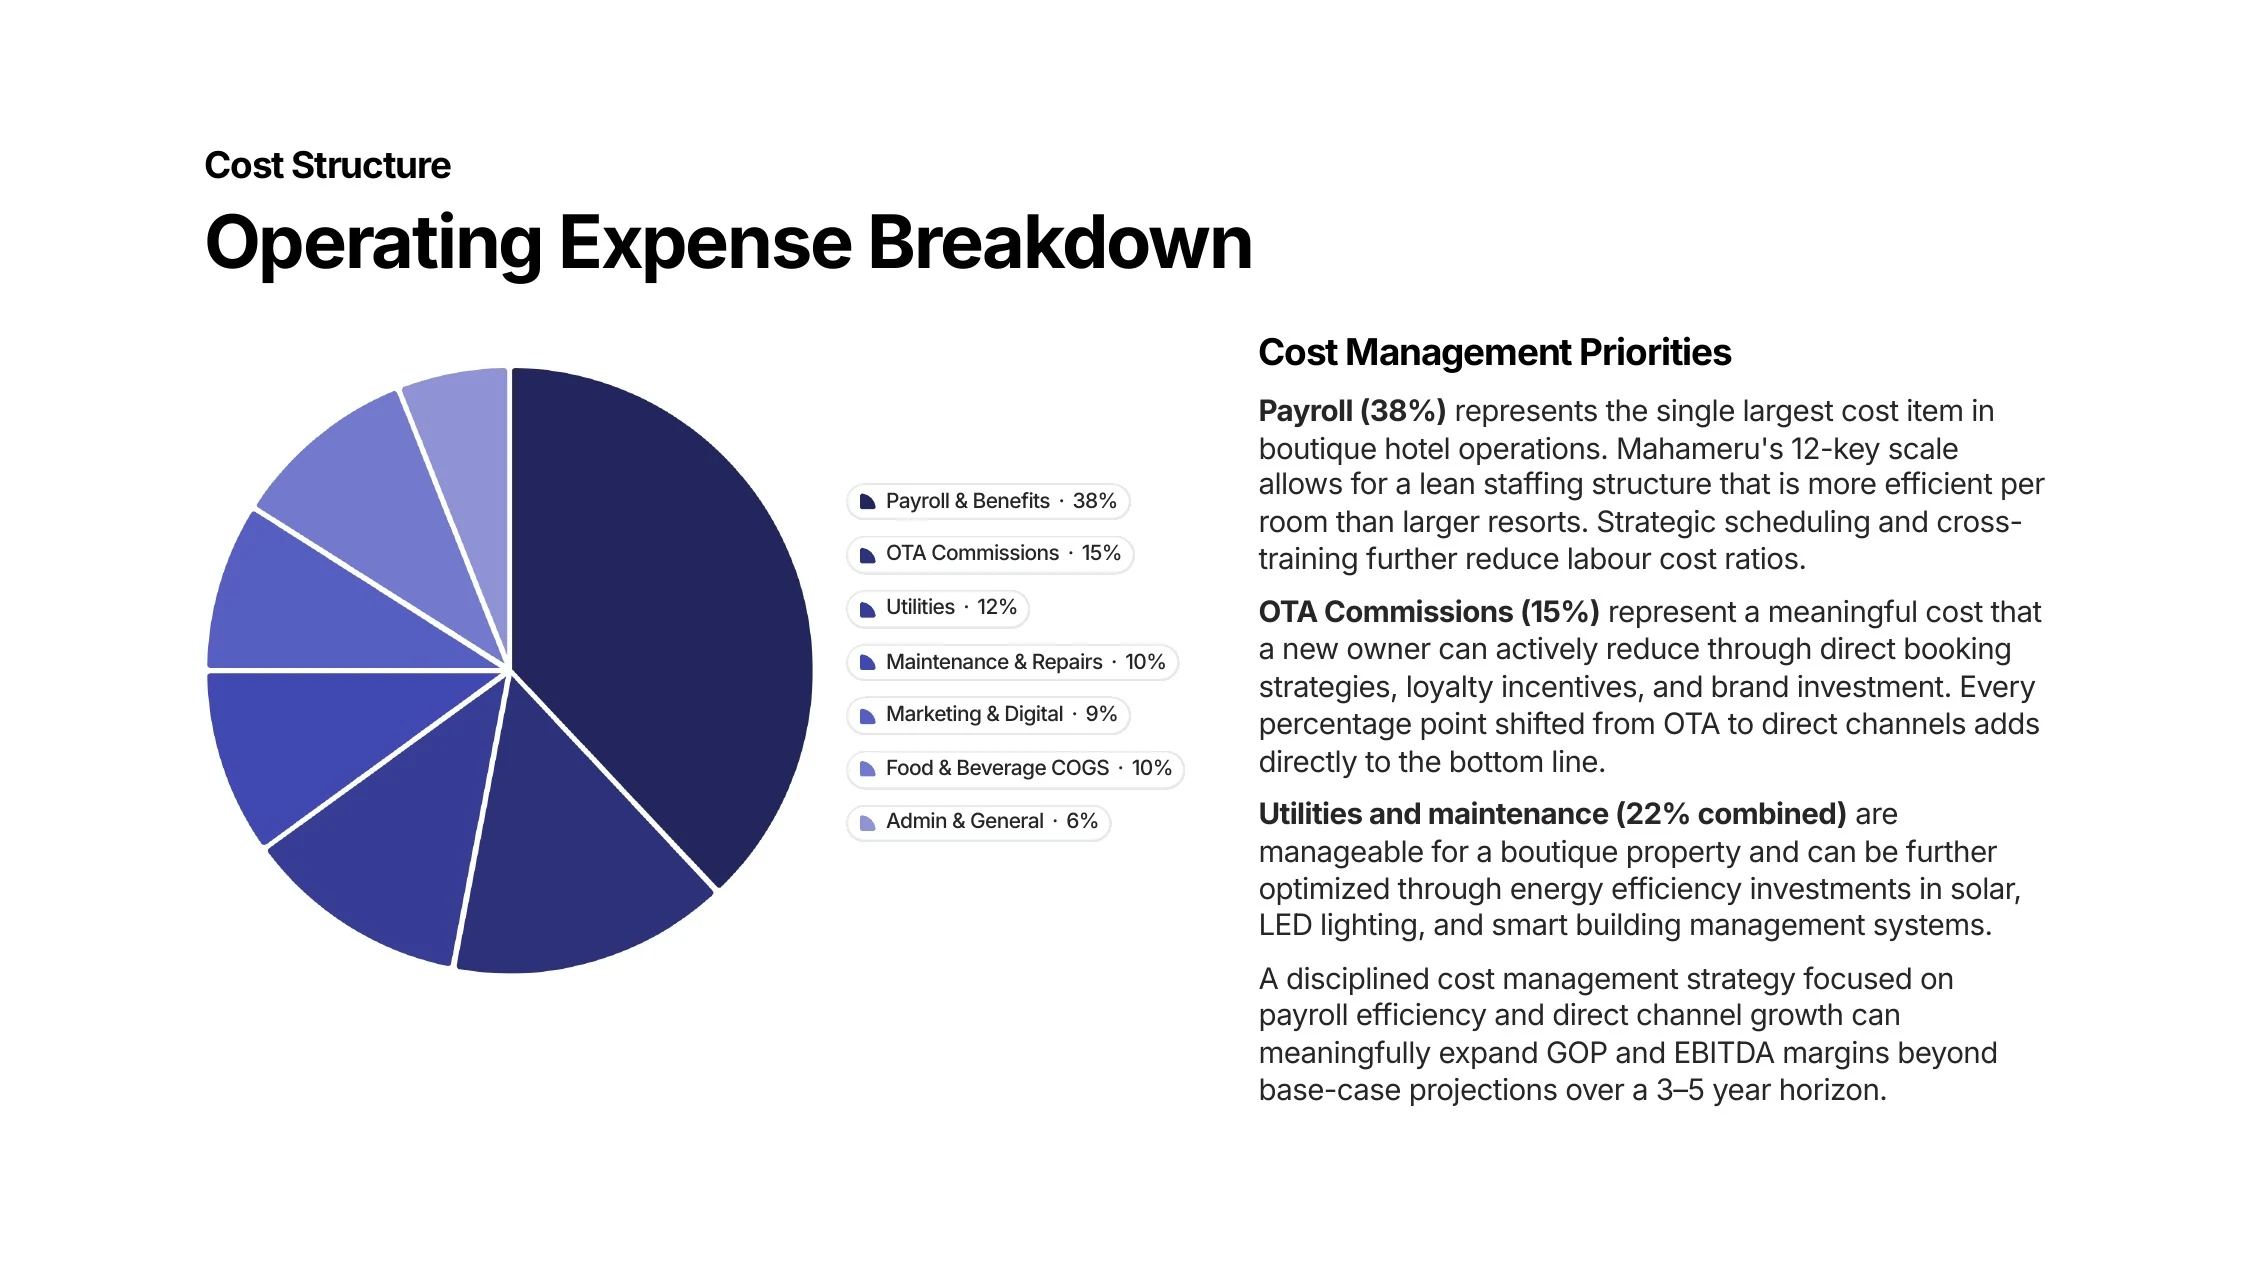
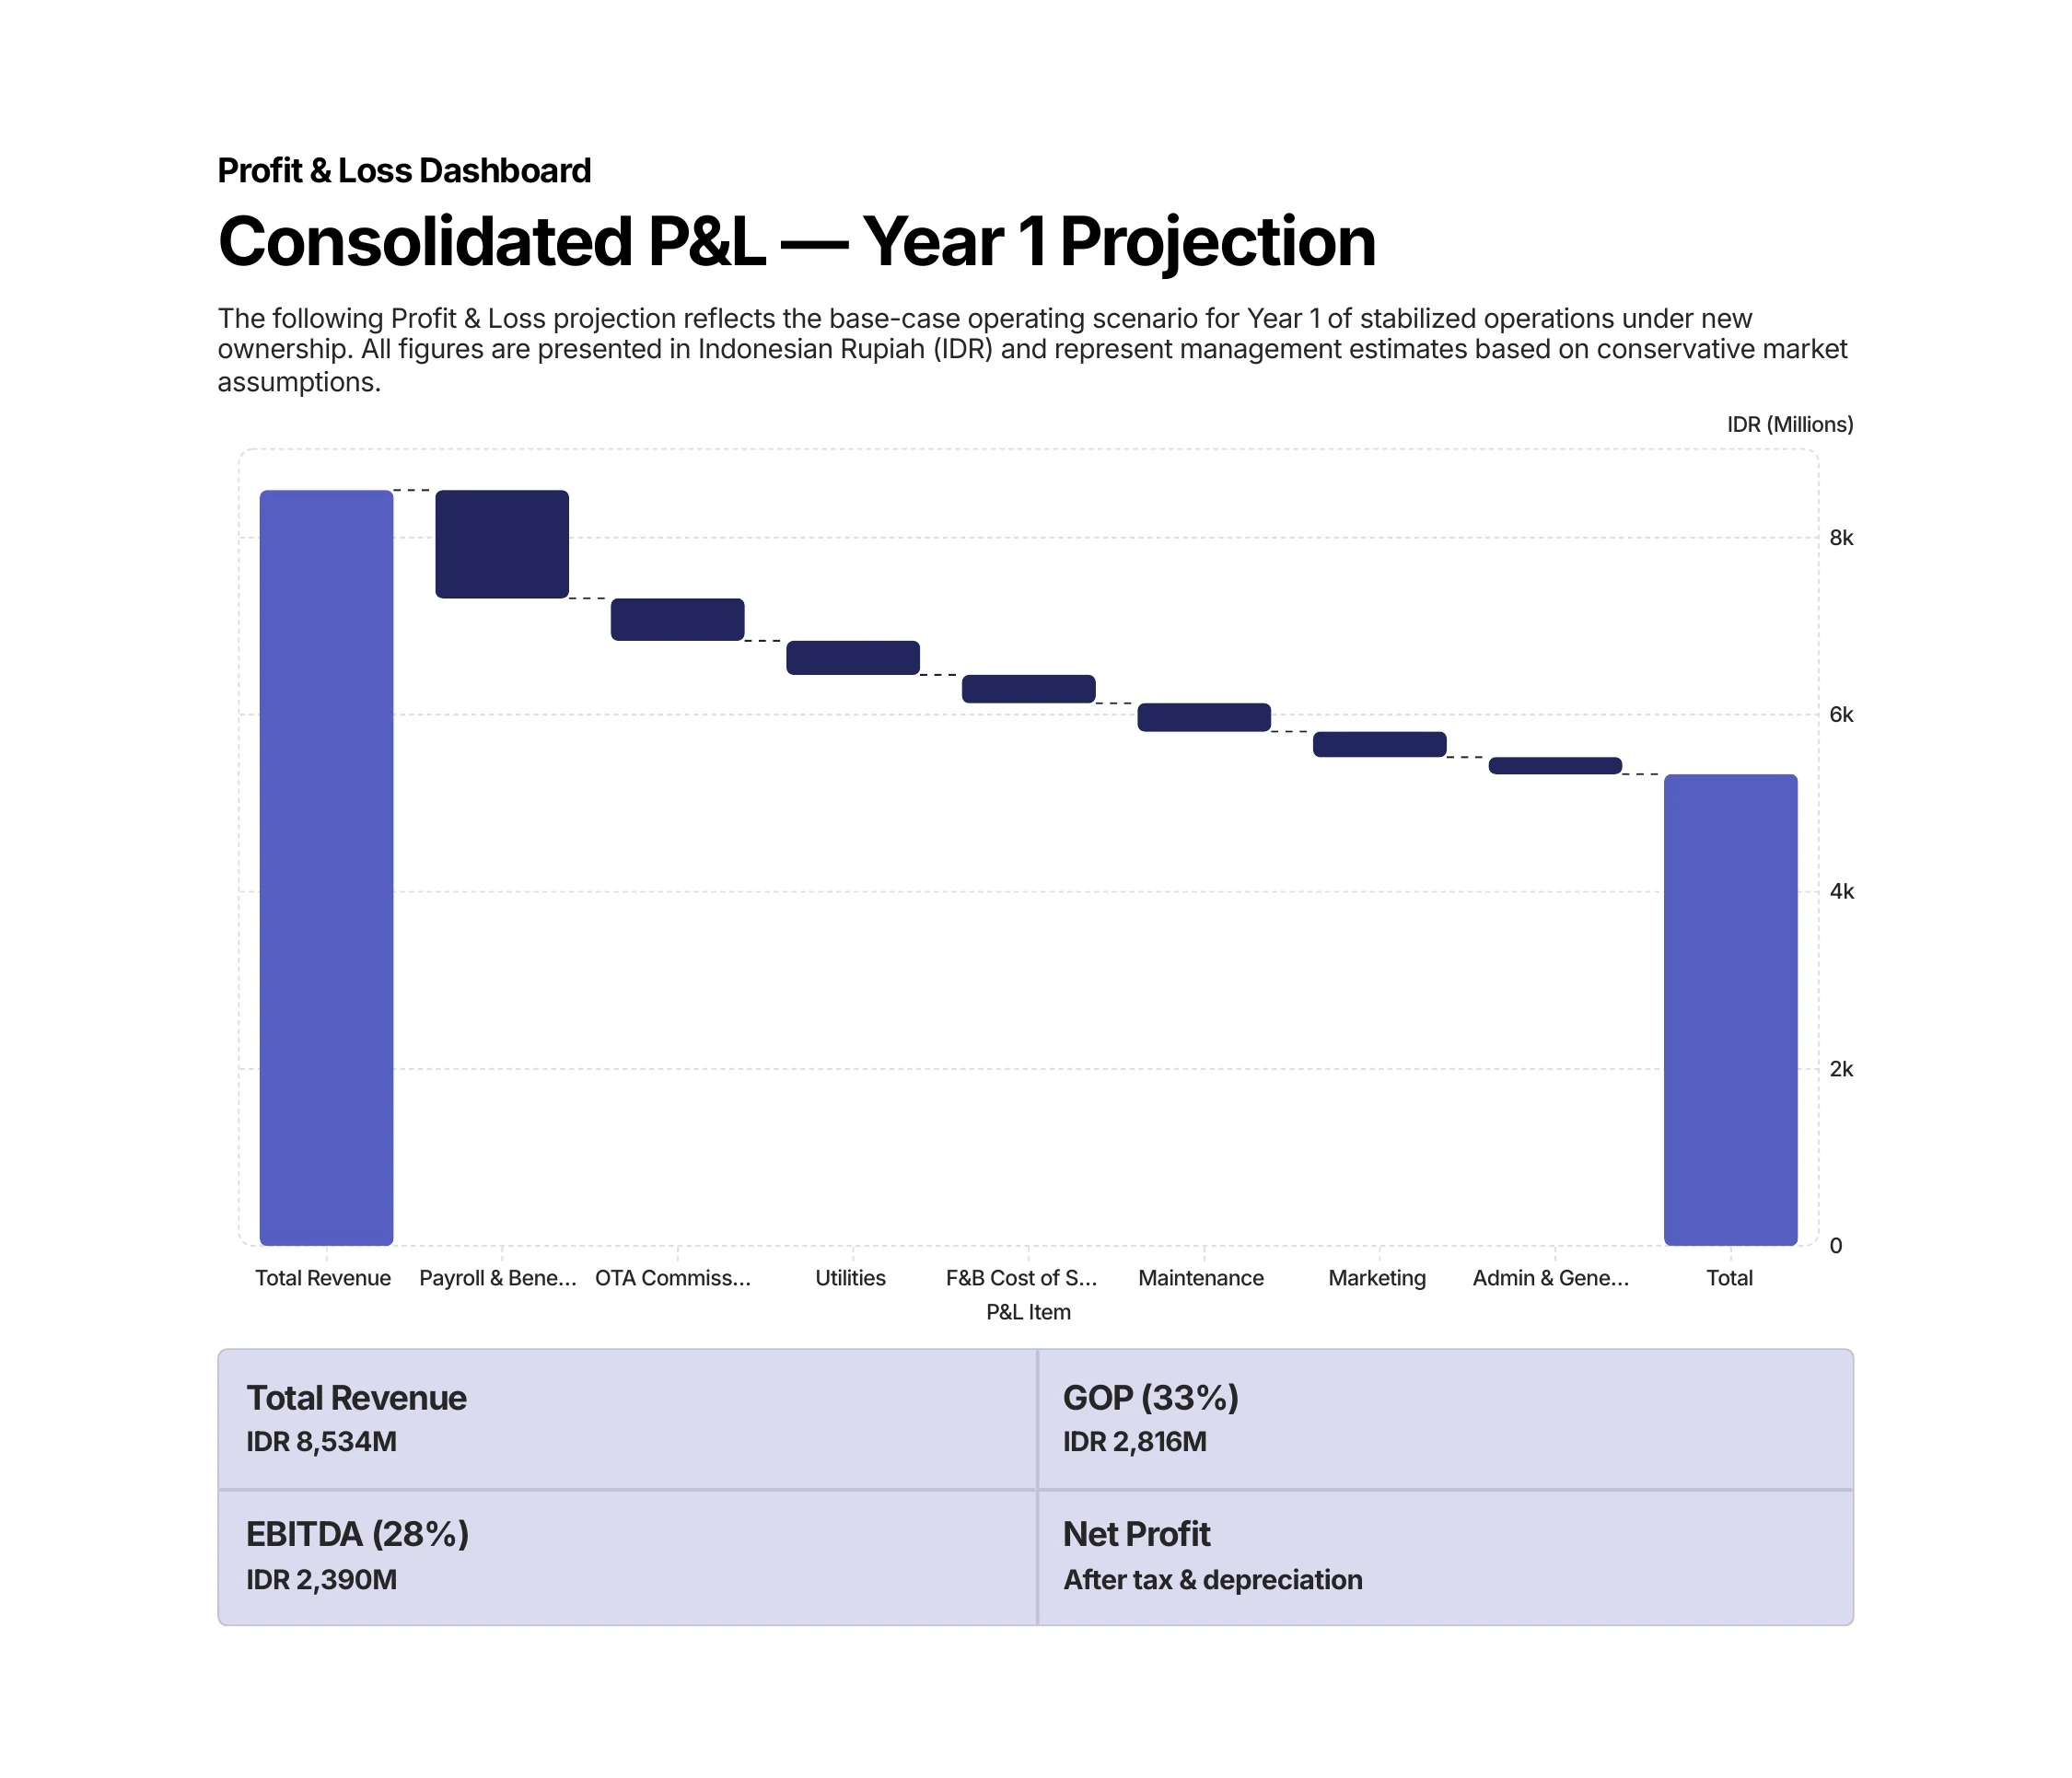
Payroll is the largest cost item, though a 12-key property can support a lean staffing model. OTA commissions offer a direct margin-improvement opportunity through direct-booking strategy and loyalty investment, while utilities and maintenance can be reduced through energy efficiency and smart-building measures.
Year 1 Profit & Loss Dashboard
Key Hotel Performance Indicators
These Year 1 stabilised KPIs use standard hospitality measures. RevPAR combines ADR and occupancy; TRevPAR includes ancillary income; and GOPPAR represents gross operating profit per available room.
Investment Analysis — Return Metrics
The return metrics use the IDR 70 billion asking price and IDR 2.390 billion base-case Year 1 EBITDA. They exclude capital appreciation, debt leverage, and value creation from operational optimisation.
| Return Enhancement Pathway | Potential Effect |
|---|---|
| Dynamic Pricing | Revenue-management software can optimise ADR by season, event, and demand cycle; the memorandum identifies potential room-revenue improvement of 10–20%. |
| Direct Booking Strategy | Reducing OTA dependence through brand and loyalty investment improves net revenue margin. |
| Ancillary Revenue Development | Packaging spa, dining, transfers, and experiences increases TRevPAR without adding keys. |
| Debt Financing | A leveraged acquisition may enhance equity returns, subject to suitable debt-service coverage. |
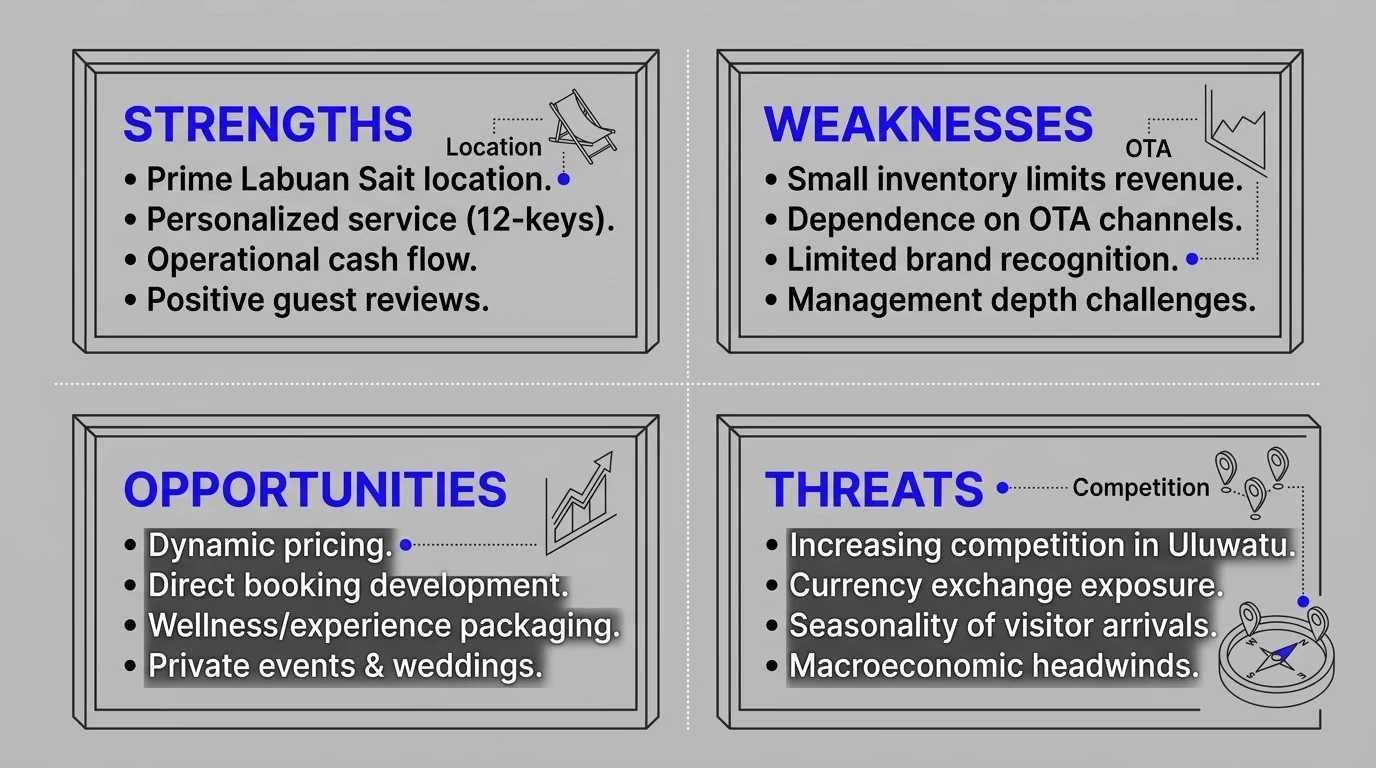
SWOT Analysis — Mahameru Uluwatu
| Dimension | Assessment |
|---|---|
| Strengths | Prime Labuan Sait location; personalised service; 12-key scale; operational cash flow; positive guest reviews. |
| Weaknesses | Small inventory limits revenue; OTA dependence; limited brand recognition; management-depth challenges. |
| Opportunities | Dynamic pricing; direct-booking development; wellness and experience packaging; private events and weddings. |
| Threats | Increasing competition in Uluwatu; currency exposure; seasonality; macroeconomic travel volatility. |
The assessment treats location and operating status as structural strengths. Most weaknesses are operational and therefore represent addressable value-creation opportunities rather than fundamental risks to the investment thesis.
Why Acquire Mahameru Uluwatu Today
| Investment Dimension | Case |
|---|---|
| 1. Immediate Operations | An income-generating hotel with no development risk, construction timeline, or pre-opening period. |
| 2. Limited Supply Window | Premium operating boutique hotels in Labuan Sait rarely become available, creating a narrow acquisition window. |
| 3. Growing Destination Momentum | Uluwatu continues its transition from surf niche to internationally recognised luxury hospitality market. |
| 4. Long-Term Appreciation | Finite land supply and growing destination recognition support the long-term real-estate value thesis. |
Acquisition Summary
| Parameter | Detail |
|---|---|
| Property Type | Boutique Hotel — Fully Operational |
| Number of Keys | 12 Guest Rooms |
| Location | Labuan Sait, Uluwatu, Bali |
| Asking Price | IDR 70,000,000,000 |
| Base ADR | IDR 2,100,000 |
| Base Occupancy | 65% |
| Year 1 Revenue | IDR 8,533,700,000 |
| GOP Margin | 33% |
| EBITDA Margin | 28% |
| Revenue Growth | 8% per annum |
| Investment Horizon | 2026–2035 |
| Target Investor | Family Offices, Private Equity, Property Funds, HNWIs, Hospitality Operators |
Room Revenue Projection — Year 1
Room revenue is the property's foundational income stream. This base case reflects current boutique hotel conditions in Uluwatu and excludes revenue-management optimisation and peak-season rate premiums.
| Room Revenue Component | Value |
|---|---|
| Number of Guest Rooms | 12 |
| Average Daily Rate | IDR 2,100,000 |
| Occupancy Rate | 65% |
| Annual Available Room Nights | 4,380 |
| Annual Occupied Room Nights | 2,847 |
| Annual Room Revenue — Year 1 | IDR 5,978,700,000 |
The base-case RevPAR is approximately IDR 1,365,000. The memorandum identifies 20–30% potential RevPAR improvement within 12–24 months for comparable properties using professional revenue management and direct-booking strategies.
Ancillary Revenue — Beyond Room Sales
| Revenue Source | Annual Projection |
|---|---|
| Restaurant & Dining | IDR 1,350,000,000 |
| Spa & Wellness Treatments | IDR 420,000,000 |
| Airport Transfer Services | IDR 120,000,000 |
| Laundry Services | IDR 95,000,000 |
| Private & Romantic Dining Events | IDR 175,000,000 |
| Tours & Curated Activities | IDR 185,000,000 |
| Other Guest Services | IDR 210,000,000 |
| Total Ancillary Revenue | IDR 2,555,000,000 |
Ancillary income represents approximately 30% of projected Year 1 revenue. Enhanced dining, wellness packages, and curated experiences could allow non-room revenue to outpace the model's 8% room-revenue growth assumption.
Total Revenue & Investment Summary
| Revenue Stream | IDR Amount | % of Total |
|---|---|---|
| Room Revenue | 5,978,700,000 | 70% |
| Restaurant & Dining | 1,350,000,000 | 16% |
| Spa & Wellness | 420,000,000 | 5% |
| Airport Transfers | 120,000,000 | 1% |
| Laundry Services | 95,000,000 | 1% |
| Private & Romantic Dining | 175,000,000 | 2% |
| Tours & Activities | 185,000,000 | 2% |
| Other Guest Services | 210,000,000 | 2% |
| Total Revenue — Year 1 | 8,533,700,000 | 100% |
| GOP | 2,816,121,000 | 33% |
| EBITDA | 2,389,436,000 | 28% |
The projection is intentionally conservative and reflects current market positioning rather than peak-season performance or optimised operations. The combination of an IDR 8.5 billion revenue base, 8% projected annual growth, a 28% EBITDA margin, and the long-term appreciation characteristics of Labuan Sait underpins the memorandum's investment thesis.
All financial parameters and return projections are indicative management estimates, not audited results or guaranteed returns. Qualified investors should conduct independent financial due diligence and consult hospitality, legal, tax, and Indonesian property specialists before making an acquisition decision.